22 navigation sections · original questions, worked solutions and the reason behind each step.
An independent study aid, not an instructor answer key. Some navigation sections group subparts or explain standard-error concepts; these are not 22 separate questions.
related video title: ECO 4000 Chapter 4 — Complete PDF Question Walkthrough
Question images are lossless crops of the original excerpts as displayed in the video. Open an image full-size to read its smallest details. The “read the question in words” version follows the transcript.
22 sections
01 / 22 · 00:00:00
Q1: What are we trying to predict?
chapter 4 guiding notes.pdf, PDF page 1, printed page 1.
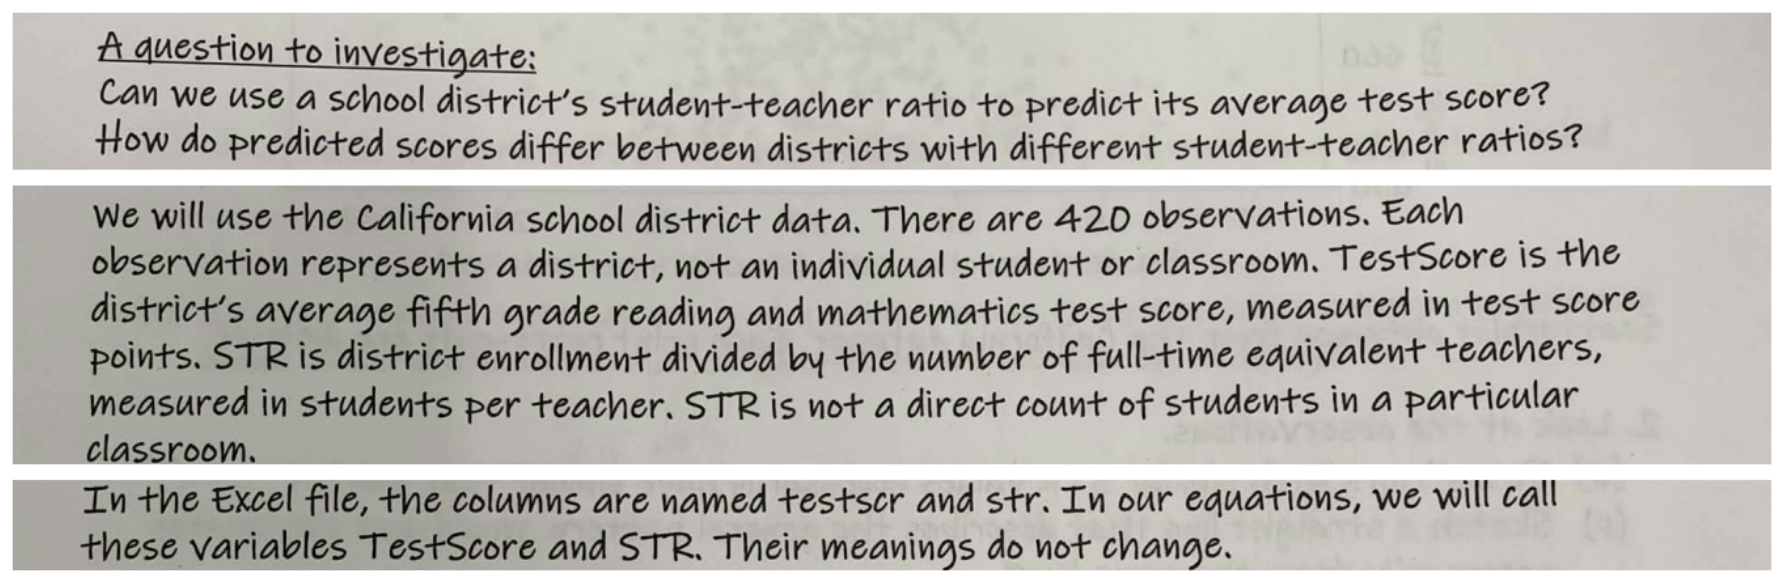
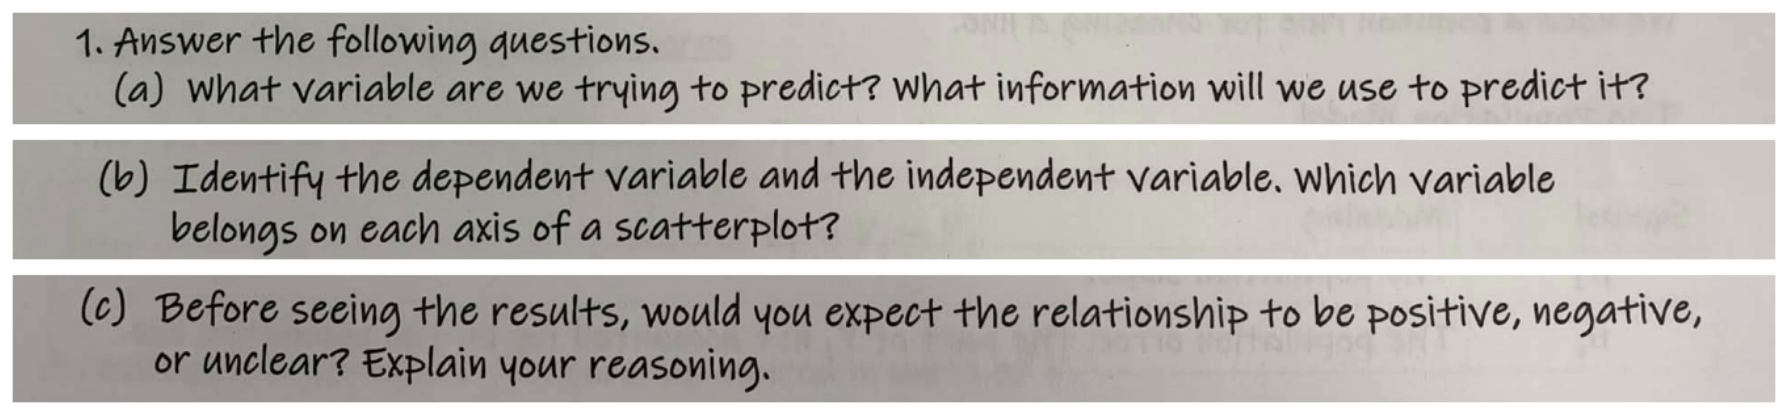
We begin with Question One on page one of the Chapter Four guiding notes. The worksheet asks whether we can use a school district's student-to-teacher ratio to predict its average test score. The dataset contains four hundred twenty districts. Test Score is the district average of fifth-grade reading and mathematics scores, measured in score points, and the student-to-teacher ratio, called S T R, is measured in students per teacher. Part a asks what we are trying to predict and what information we will use. Part b asks us to identify the dependent and independent variables and place them on a scatterplot's axes. Part c asks whether, before seeing the results, we expect a positive, negative, or unclear relationship, and why.
try it first
Name the quantity, choose the method and keep track of the units before opening the solution.
show worked solution
420 districts
Y: average district TestScore, points
X: STR, students/teacher
step by step
Y = TestScore: the outcome we predict
X = STR: the clue used to predict Y
Horizontal axis: X; vertical axis: Y
A negative relationship is plausible; inspect the data first.
why it works
Start with the sentence, predict test score using the ratio. The thing after predict is the outcome, Y. The clue after using is X. So Test Score is the dependent variable and S T R is the independent variable or regressor. Put S T R on the horizontal axis and Test Score on the vertical axis.
The word independent here is a label for a regressor. It does not claim that X and Y are unrelated. Also, every observation is a district, not an individual student. The ratio is district enrollment divided by full-time-equivalent teachers. It is not necessarily the exact headcount in a particular classroom.
For part c, a negative relationship is a reasonable prediction: more students per teacher might be associated with lower scores. But that is a reasoned expectation, not something established before looking at the data. Other influences may matter. An answer that carefully explains uncertainty is different from claiming the sign has already been proved.
final answer
Y = TestScore; X = STR. A negative association is a plausible expectation to check against data.
takeaway
Start by naming the outcome, the predictor and the units before reading a regression.
02 / 22 · 00:02:04
Q2: Read the scatterplot before drawing a line
chapter 4 guiding notes.pdf, PDF page 2, printed page 2.
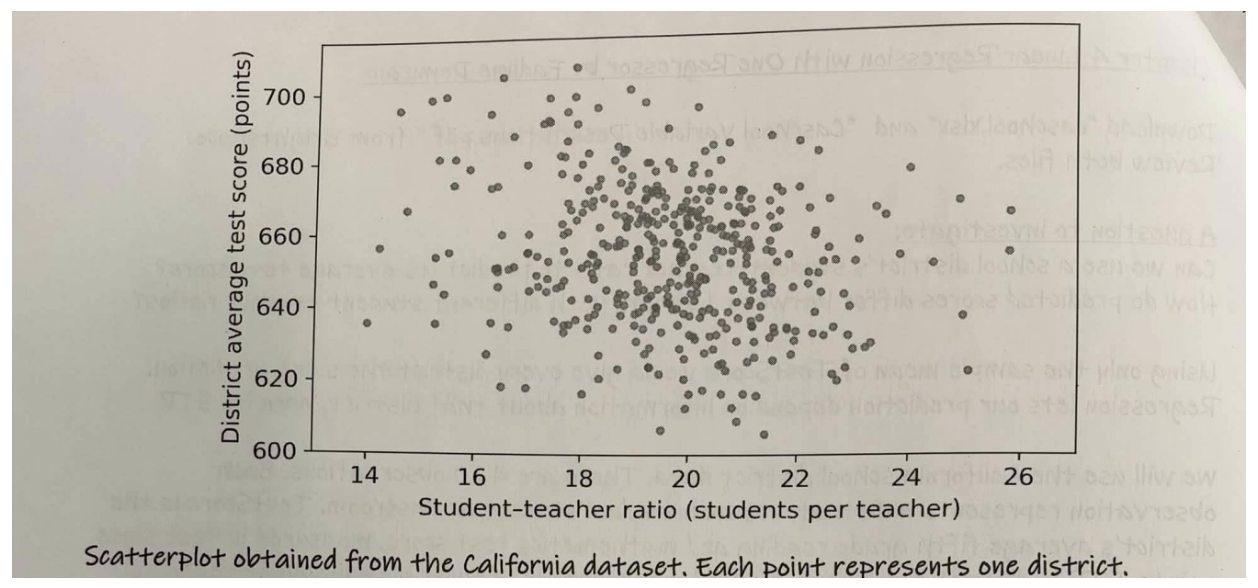
Question Two shows the California district scatterplot. Each dot represents one district, with its student-to-teacher ratio across the bottom and its average score vertically. Part a asks whether the overall relationship appears positive or negative and whether it is exact. Part b asks whether districts with similar ratios necessarily have similar scores. Part c asks you to sketch a straight line describing the general pattern and consider whether classmates would necessarily draw the same line.
try it first
Name the quantity, choose the method and keep track of the units before opening the solution.
show worked solution
Scatterplot of420districts
step by step
Overall association: negative, weak, and far from exact
Similar STR values can have very different scores
A trend does not force every observation onto a line
OLS supplies a common rule for fitting the line
why it works
Look at the cloud rather than choosing two convenient dots. The general tendency slopes downward, so the association appears negative, but it is weak and far from exact. At a ratio near twenty, there are districts with noticeably different scores. Therefore similar X values do not force similar Y values.
A sensible sketch slopes downward through the middle of the cloud. Two people can draw different reasonable-looking lines because eyeballing is subjective. That motivates an objective rule for choosing coefficients.
The plotted dots are observations; the line will be a summary of their average tendency. Do not confuse a trend with a law that every dot must obey. Later, a low R squared will put a number on this substantial scatter. But we already see the qualitative fact here: one predictor leaves much of the outcome's variation unexplained.
final answer
The observed relationship is negative and scattered. A fitting rule is needed because sketches can differ.
takeaway
A downward trend can coexist with wide scatter. A trend is not an exact rule for every observation.
03 / 22 · 00:03:44
Q3: Translate the population model
chapter 4 guiding notes.pdf, PDF page 3, printed page 3.
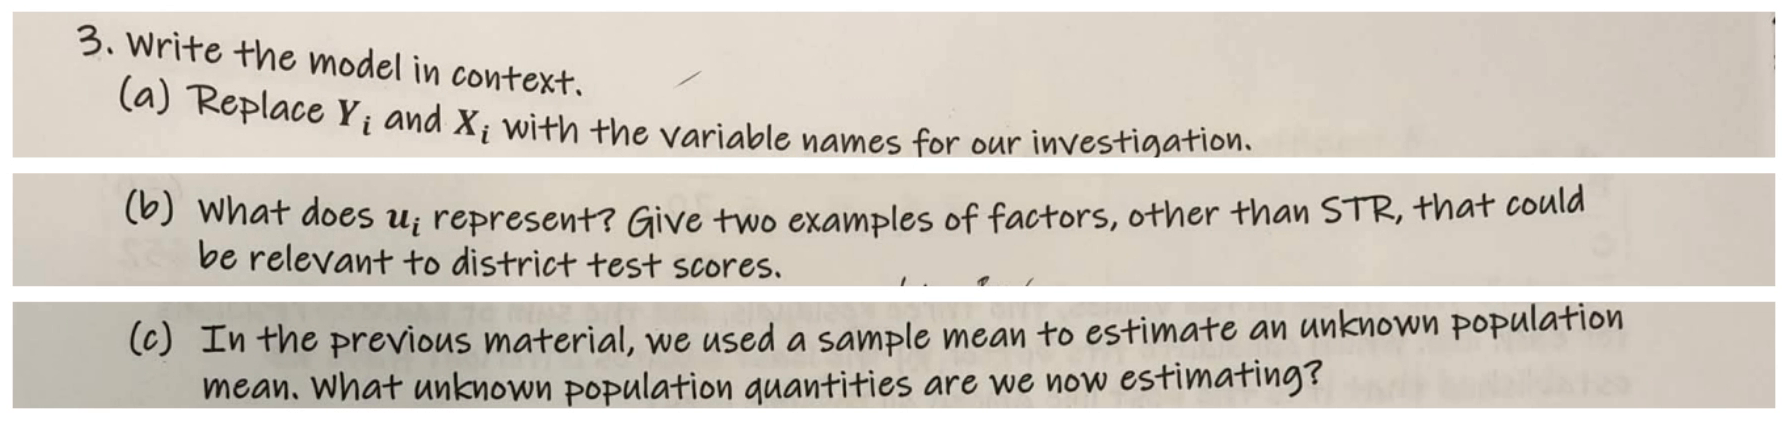
Question Three asks us to write the population regression model in this school-district context. Part a says to replace Y and X with the actual variable names. Part b asks what the error term represents and requests two other factors that could be relevant to district test scores. Part c reminds us that a sample mean estimates a population mean and asks which unknown population quantities we are now estimating.
try it first
Name the quantity, choose the method and keep track of the units before opening the solution.
show worked solution
PopulationYi=β0+β1Xi+ui
YTestScore;XSTR
step by step
TestScoreᵢ = β₀ + β₁STRᵢ + uᵢ
Estimate the unknown β₀ and β₁
Other influences may include family resources and language background
why it works
Write Test Score for district i equals beta zero plus beta one times S T R for district i, plus u for district i. The i just labels a district. Beta zero is the population intercept, and beta one is the population slope. Those two unknown coefficients are the quantities we estimate.
The error term is the part of the outcome not accounted for by the population line. It does not necessarily mean a typo or a mistake in data entry. For instance, family resources and language background may be relevant to test scores beyond the staffing ratio. Those are examples of other influences, not a claim that we have measured them here.
Think of the equation as a general trend plus everything left over. Once we fit a line to our sample, we use hats for estimated coefficients. A fitted value has no added error term. The actual observed score can instead be written as the fitted value plus its residual. The population error and the observable sample residual play related but different roles.
final answer
Estimate the population intercept and slope. The error represents outcome influences beyond the population line.
takeaway
The population line describes the systematic part; the error contains what the line leaves out.
04 / 22 · 00:05:30
Q4: Compare two candidate lines
chapter 4 guiding notes.pdf, PDF page 4, printed page 4.
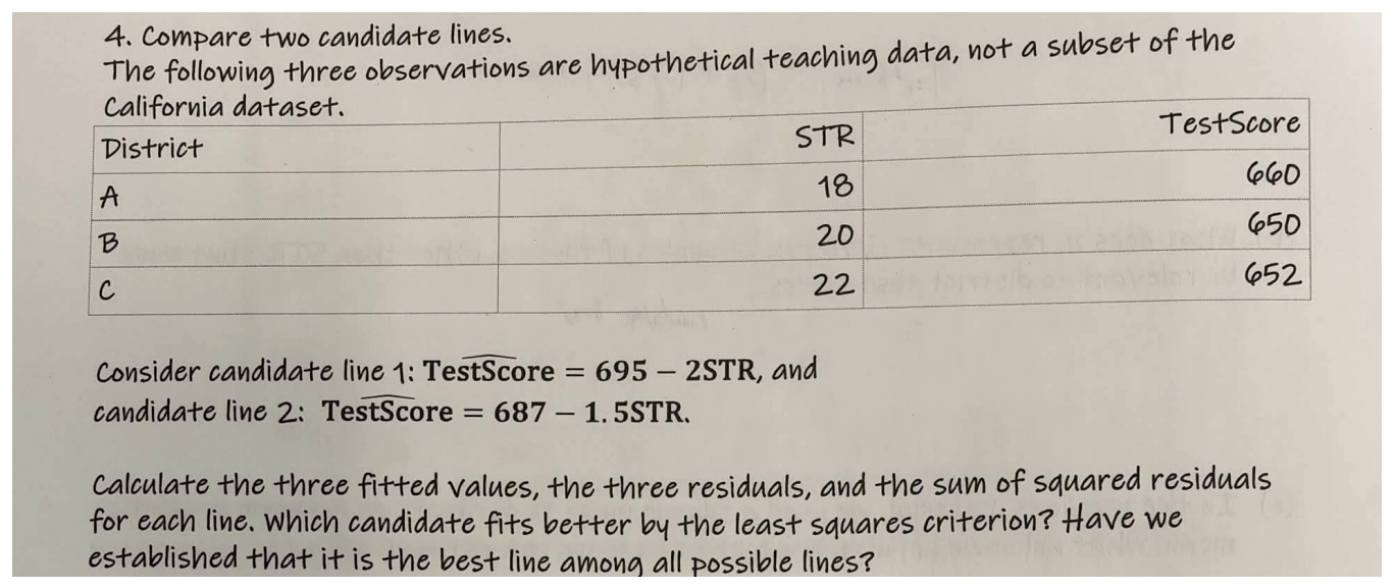
Question Four gives three hypothetical districts, explicitly not a subset of the California data. District A has a ratio of eighteen and score six hundred sixty. B has ratio twenty and score six hundred fifty. C has ratio twenty-two and score six hundred fifty-two. Candidate line one predicts Test Score as six hundred ninety-five minus two times S T R. Candidate line two predicts six hundred eighty-seven minus one point five times S T R. Calculate each line's three fitted values, residuals, and sum of squared residuals. Which candidate fits better by least squares? Have we established the best line among all possible lines?
try it first
Name the quantity, choose the method and keep track of the units before opening the solution.
27 < 53: line 1 fits these three observations better
why it works
We need a common score for prediction mistakes. A fitted value comes from substituting X into the line. A residual is actual minus fitted, not the other way around.
For line one, A is predicted as six hundred ninety-five minus thirty-six, or six hundred fifty-nine. Its residual is one. B's prediction is six hundred fifty-five, giving a residual of negative five. C's prediction is six hundred fifty-one, giving a residual of one. Square these residuals and add: one plus twenty-five plus one equals twenty-seven.
For line two, the predictions are six hundred sixty, six hundred fifty-seven, and six hundred fifty-four. The residuals are zero, negative seven, and negative two. The squared total is zero plus forty-nine plus four, or fifty-three.
Line one wins this comparison because twenty-seven is smaller. Squaring prevents positive and negative errors from canceling and penalizes large misses. But comparing two candidates does not establish the best line among every possible intercept and slope. The question's last sentence is testing that distinction. We have a winner among these two, not a proof of the global least-squares solution.
final answer
Line 1: SSR = 27 versus 53. It wins this two-line comparison; global optimality is not proved.
takeaway
Compare candidates using squared residuals. Winning a two-line comparison does not prove global optimality.
05 / 22 · 00:07:43
Q5: Obtain slope and intercept from summary statistics
chapter 4 guiding notes.pdf, PDF page 5, printed page 5.
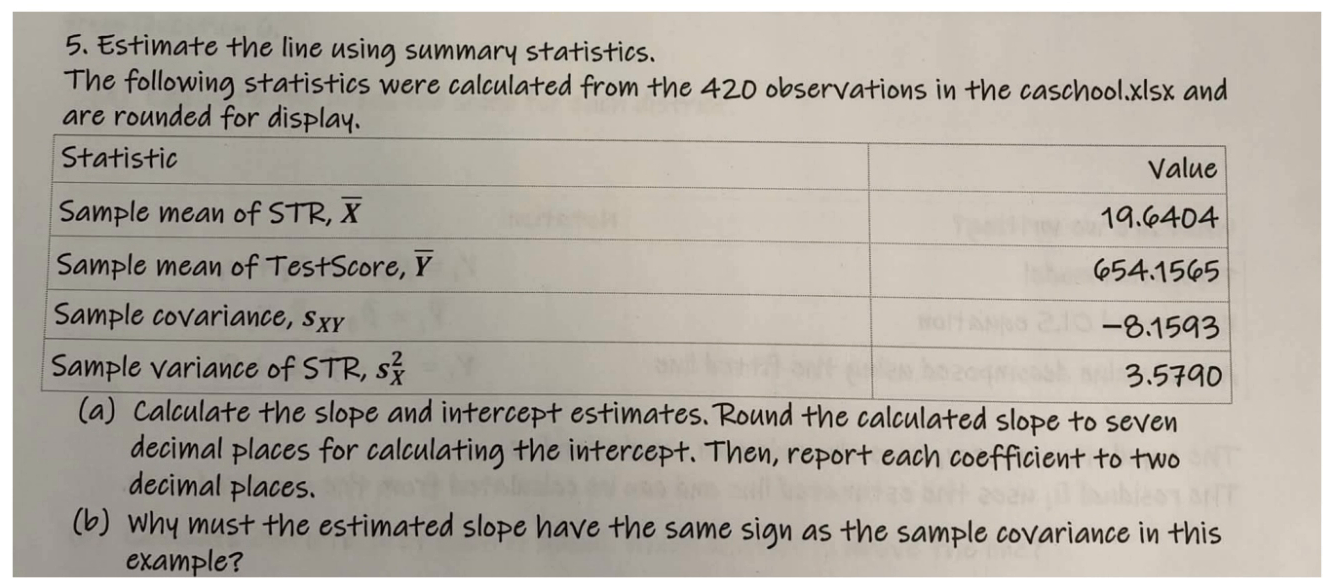
Question Five provides summary statistics from the four hundred twenty California districts. Mean S T R is nineteen point six four zero four. Mean Test Score is six hundred fifty-four point one five six five. The sample covariance is negative eight point one five nine three, and the sample variance of S T R is three point five seven nine zero. Part a asks for the slope and intercept, using seven decimal places for the calculated slope when computing the intercept and reporting both coefficients to two decimals. Part b asks why the slope must have the same sign as the covariance here.
try it first
Name the quantity, choose the method and keep track of the units before opening the solution.
show worked solution
Xbar19.6404
Ybar654.1565
sXY−8.1593
sX²3.5790
step by step
β̂₁ = −8.1593 / 3.5790 = −2.2797709
β̂₀ = 654.1565 − (−2.2797709)(19.6404) ≈ 698.9321
Rounded: β̂₀ = 698.93; β̂₁ = −2.28
why it works
The slope is sample covariance divided by the sample variance of X. In plain terms, joint movement gets scaled by how much the predictor varies. Use the variance of S T R in the denominator, not its standard deviation and not the variance of Test Score.
Negative eight point one five nine three divided by three point five seven nine zero gives negative two point two seven nine seven seven zero nine after the specified seven-decimal rounding. Now compute the intercept as mean Y minus slope times mean X. That is six hundred fifty-four point one five six five minus the product of negative two point two seven nine seven seven zero nine and nineteen point six four zero four. It gives approximately six hundred ninety-eight point nine three two one.
Report the intercept as six hundred ninety-eight point nine three and the slope as negative two point two eight. The variance in the denominator is positive, so dividing by it cannot flip the covariance's sign. Negative covariance means negative slope here.
These supplied summary statistics are rounded. Slight differences from the full-precision Excel coefficients are expected; they do not mean one calculation is wrong.
final answer
Predicted TestScore = 698.93 − 2.28 STR. The slope has the covariance’s negative sign.
takeaway
Divide covariance by the variance of X, then use the sample means to anchor the intercept.
06 / 22 · 00:09:54
Q6: Fitted value versus actual outcome
chapter 4 guiding notes.pdf, PDF page 6, printed page 6.
Question Six asks you to write the fitted equation using Question Five's estimates: an intercept of six hundred ninety-eight point nine three and a slope of negative two point two eight points per additional student per teacher. Part a asks whether the left side should be actual Test Score or predicted Test Score, and whether an error term should be added to the fitted value. Part b asks how to write the actual observed Test Score using the fitted line and a residual.
try it first
Name the quantity, choose the method and keep track of the units before opening the solution.
show worked solution
Estimatedintercept698.93,slope−2.28
step by step
Predicted TestScore = 698.93 − 2.28 STR
Actual Yᵢ = Ŷᵢ + ûᵢ
Population error uᵢ and sample residual ûᵢ are different
why it works
The fitted equation is predicted Test Score equals six hundred ninety-eight point nine three minus two point two eight times S T R. A hat over Test Score communicates predicted, not actual. Do not add an error term to this predicted value.
If you want to describe an actual observation, write actual Test Score equals the fitted value plus that observation's residual. Equivalently, use the estimated intercept and slope, then add the residual with a hat.
The bottom table distinguishes three things. The population model uses unknown beta coefficients and the population error u. The estimated equation uses estimated coefficients and gives Y hat. The actual outcome is Y hat plus the sample residual.
You can calculate residuals because you have the observations and fitted line. You do not directly observe the true population line, so you should not casually substitute the population error for the sample residual. In everyday terms: prediction is our rule's answer, actual is what happened, and residual is the gap.
final answer
Fitted prediction: no added error. Actual outcome = fitted value + sample residual.
takeaway
The fitted value is the line’s prediction; adding the residual gives the actual outcome.
07 / 22 · 00:11:45
Q7: Calculate and interpret two residuals
chapter 4 guiding notes.pdf, PDF page 7, printed page 7.
Question Seven describes two hypothetical districts with the same student-to-teacher ratio, twenty. District A actually scores six hundred forty, and district B scores six hundred seventy. The rounded equation predicts Test Score as six hundred ninety-eight point nine three minus two point two eight times S T R. Part a asks for each predicted score. Part b asks you to calculate and interpret both residuals and identify which district is above the line.
try it first
Name the quantity, choose the method and keep track of the units before opening the solution.
show worked solution
STR20both
ActualA640,B670
ŷ698.93−2.28STR
step by step
Ŷ = 698.93 − 2.28(20) = 653.33 for both districts
A: û = 640 − 653.33 = −13.33 points; overpredicted
B: û = 670 − 653.33 = +16.67 points; underpredicted
why it works
Substitute twenty into the line. Two point two eight times twenty is forty-five point six. Subtracting from six hundred ninety-eight point nine three gives six hundred fifty-three point three three. Both districts receive that prediction because the only predictor has the same value.
For A, subtract prediction from actual: six hundred forty minus six hundred fifty-three point three three equals negative thirteen point three three. The prediction was too high, so A is overpredicted and lies below the line.
For B, six hundred seventy minus six hundred fifty-three point three three equals positive sixteen point six seven. The prediction was too low, so B is underpredicted and lies above the line.
Do not assume that equal X values force equal actual outcomes. The one-predictor rule gives equal fitted values, but other influences can make the actual scores differ. Both residuals are measured in test-score points, not percentages or students per teacher.
final answer
A: −13.33 points, below the line and overpredicted. B: +16.67 points, above and underpredicted.
takeaway
Residuals are actual minus predicted. Their signs tell you whether the line overpredicts or underpredicts.
08 / 22 · 00:13:31
Q8 and output: Select the correct Excel ranges
chapter 4 guiding notes.pdf, PDF page 8, printed page 8.
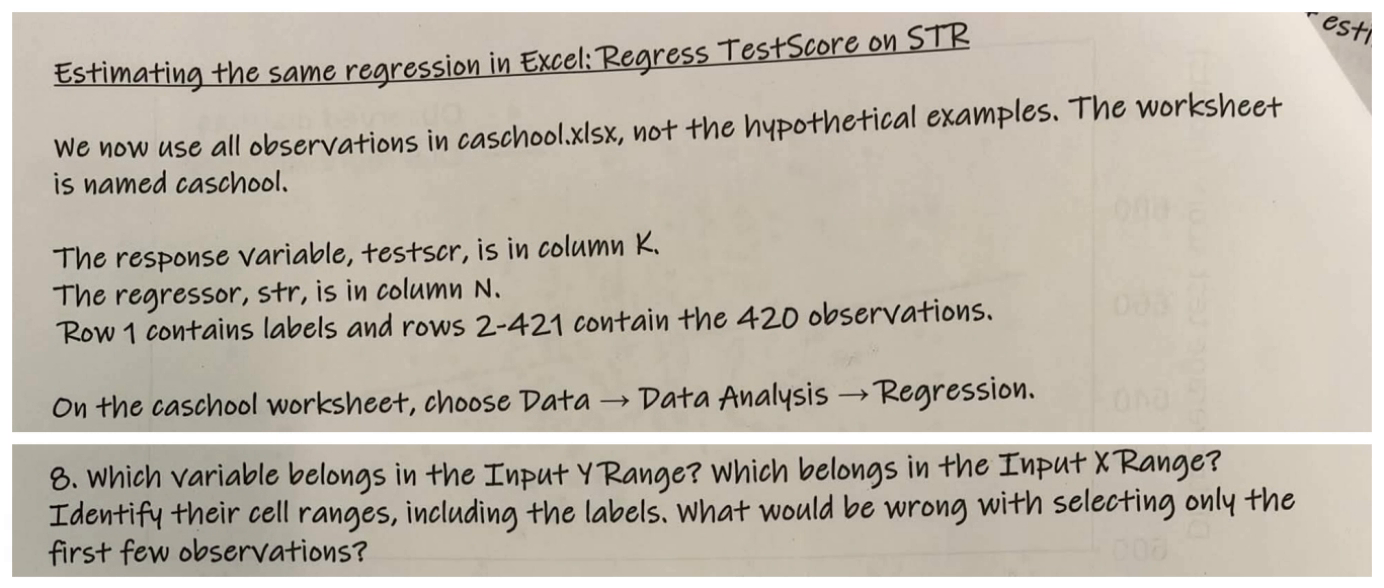
Question Eight describes the caschool worksheet. The response variable testscr is in column K, the regressor str is in column N, row one contains labels, and rows two through four hundred twenty-one contain the four hundred twenty observations. Which variable and cell range belongs in Input Y Range and Input X Range, including labels? What would be wrong with selecting only the first few observations?
try it first
Name the quantity, choose the method and keep track of the units before opening the solution.
show worked solution
YcolumnK
XcolumnN
Labelsrow1
Data2:421
step by step
Input Y Range: K1:K421
Input X Range: N1:N421
Check Labels; include the intercept; request residuals
Use all 420 observations, not the first few rows
SER ≈ 18.58 points; slope SE ≈ 0.48: different jobs
why it works
Input Y Range is K one through K four hundred twenty-one, because test score is the outcome. Input X Range is N one through N four hundred twenty-one, because the ratio is the predictor. Check Labels when including row one. Leave Constant is Zero unchecked because our model estimates an intercept. The worksheet also asks for residual output.
Selecting only the first few observations would estimate a different regression using a different sample. It would not reproduce the four hundred twenty-district analysis.
Now look at the actual Excel output on the next PDF page. The coefficient rows show intercept about six hundred ninety-eight point nine three and slope about negative two point two eight. The regression-statistics standard error, about eighteen point five eight, is S E R. The slope row's standard error, about zero point four eight, is uncertainty in the slope estimate. These are not interchangeable even though Excel uses the words standard error for both.
This is a reading walkthrough, not a live Excel installation demonstration. On the paper exam, the same skill is identifying the correct row and quantity in supplied output.
final answer
Y: K1:K421. X: N1:N421. Include labels and all 420 districts; distinguish SER from a coefficient SE.
takeaway
Use the full sample and the right outcome/predictor ranges. SER and a coefficient standard error measure different things.
09 / 22 · 00:15:28
Q9(a,b): Interpret slope and intercept
chapter 4 guiding notes.pdf, PDF page 10, printed page 10.
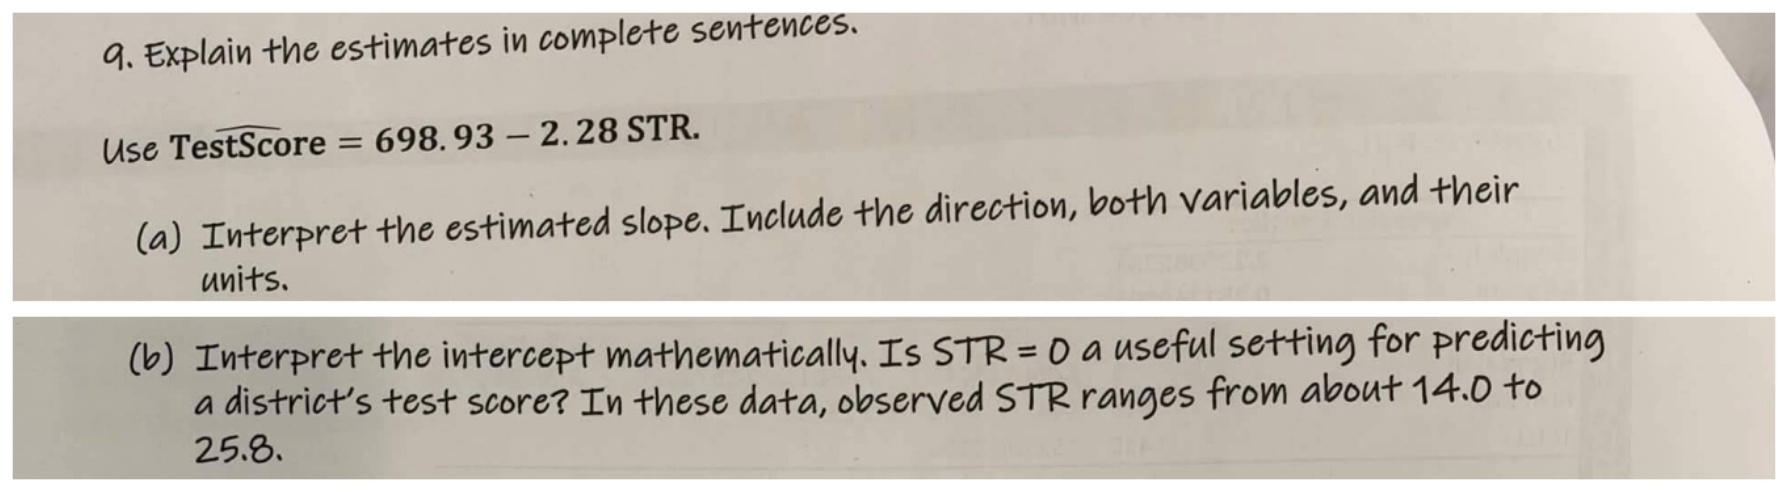
Question Nine uses predicted Test Score equal to six hundred ninety-eight point nine three minus two point two eight times S T R. Part a asks for a complete slope interpretation including direction, both variables, and their units. Part b asks you to interpret the intercept mathematically and decide whether S T R equal to zero is useful for prediction, given that observed ratios range from about fourteen to twenty-five point eight.
try it first
Name the quantity, choose the method and keep track of the units before opening the solution.
show worked solution
ŷ698.93−2.28STR
ObservedXabout14–25.8
step by step
+1 student per teacher → predicted TestScore 2.28 points lower
Intercept: predicted 698.93 points at STR = 0
STR = 0 lies far outside the observed range 14.0–25.8
why it works
A one-unit increase in the district student-to-teacher ratio, meaning one additional student per teacher, is associated with a predicted average test score two point two eight points lower. Include associated with, points, and students per teacher. Do not turn the slope into a percentage or guarantee an individual student's outcome.
The intercept is the predicted score when the ratio equals zero. Mathematically that prediction is six hundred ninety-eight point nine three. But zero lies far outside the observed range and is not a useful real-world setting for this district prediction.
An intercept can be necessary to position the fitted line even when its zero-X interpretation is not meaningful in practice. Likewise, being able to plug a number into an equation does not establish that the resulting prediction is supported by the observed data. Distinguish the equation's mathematical meaning from its empirical usefulness.
final answer
Slope: −2.28 score points per additional student per teacher. STR = 0 makes the intercept impractical here.
takeaway
Interpret a slope with units; check whether the intercept refers to a plausible X value.
10 / 22 · 00:17:10
Q9(c,d,e): Predicted levels, changes, and causation
chapter 4 guiding notes.pdf, PDF page 10, printed page 10.
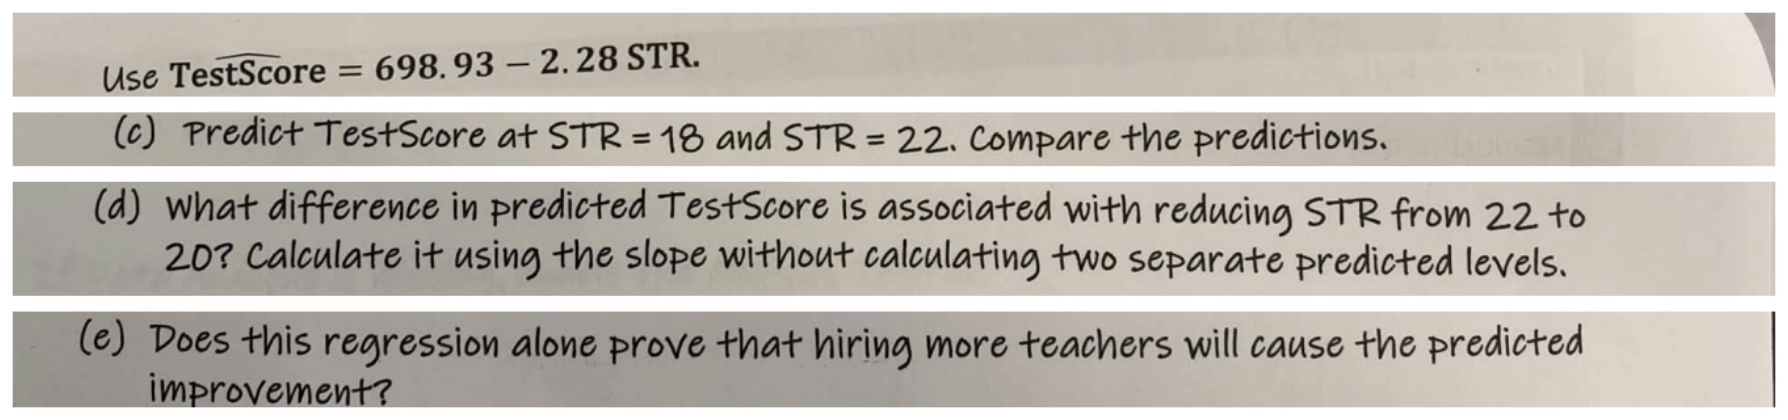
The remaining parts of Question Nine use predicted Test Score equal to six hundred ninety-eight point nine three minus two point two eight times S T R, with scores in points and S T R in students per teacher. Part c asks you to predict Test Score when S T R is eighteen and twenty-two, then compare the predictions. Part d asks for the predicted difference when the ratio falls from twenty-two to twenty, using the slope rather than calculating two levels. Part e asks whether the regression alone proves that hiring more teachers will cause the predicted improvement.
try it first
Name the quantity, choose the method and keep track of the units before opening the solution.
show worked solution
ŷ698.93−2.28STR
X18,22
Change22→20
step by step
At STR = 18: Ŷ = 698.93 − 2.28(18) = 657.89
At STR = 22: Ŷ = 698.93 − 2.28(22) = 648.77
648.77 − 657.89 = −9.12 points
22 → 20: ΔX = −2; ΔŶ = (−2.28)(−2) = +4.56 points
A predicted association alone does not establish causation
why it works
At eighteen, multiply two point two eight by eighteen to get forty-one point zero four. Subtract from six hundred ninety-eight point nine three: the prediction is six hundred fifty-seven point eight nine. At twenty-two, the product is fifty point one six and the prediction is six hundred forty-eight point seven seven. The higher-ratio district has a prediction nine point one two points lower.
For the change from twenty-two to twenty, write new minus old. Twenty minus twenty-two equals negative two. Multiply the slope, negative two point two eight, by negative two. The predicted change is positive four point five six points. Two negatives make a positive increase.
Part e asks about a different issue, causation. The fitted relationship alone does not prove that hiring teachers causes that exact improvement. Other factors related to both staffing and scores may matter. Our calculation describes the model's predicted association; a causal interpretation needs additional justification.
final answer
Predictions: 657.89 and 648.77 points. Reducing STR 22 → 20 gives a predicted +4.56 points; causation needs support.
takeaway
For changes, multiply the slope by the change in X. A fitted association alone is not causal evidence.
11 / 22 · 00:19:05
Q10: Calculate and interpret fit
chapter 4 guiding notes.pdf, PDF page 12, printed page 12.
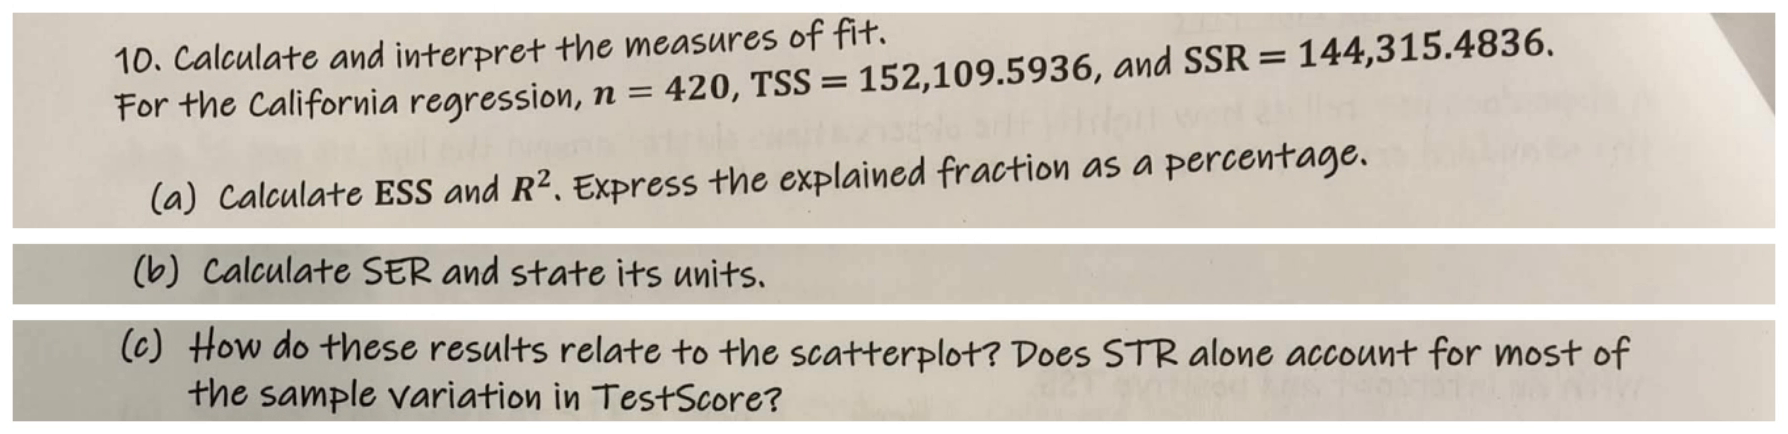
Question Ten gives four hundred twenty observations, total sum of squares one hundred fifty-two thousand one hundred nine point five nine three six, and residual sum of squares one hundred forty-four thousand three hundred fifteen point four eight three six. Part a asks for explained sum of squares and R squared, expressed as a percentage. Part b asks for S E R and its units. Part c asks how these results relate to the scatterplot and whether S T R alone accounts for most of the score variation.
try it first
Name the quantity, choose the method and keep track of the units before opening the solution.
show worked solution
n420
TSS152109.5936
SSR144315.4836
step by step
ESS = TSS − SSR = 7,794.1100
R² = ESS / TSS ≈ 0.05124 = 5.124%
SER = √(144,315.4836 / 418) ≈ 18.58 score points
why it works
First recall the labels on page eleven. T S S measures squared distances from actual outcomes to the sample mean. E S S measures the part accounted for by the fitted values. S S R is the sum of squared residuals. In this course, S S R means residual, not regression sum of squares.
Explained sum of squares is total minus residual, giving seven thousand seven hundred ninety-four point one one. Divide explained by total, or compute one minus residual divided by total. R squared is approximately zero point zero five one two four, which is about five point one two four percent.
For S E R, divide the residual sum of squares by n minus two, or four hundred eighteen, then take the square root. The result is about eighteen point five eight score points. It measures a typical scale of scatter around the line, not an exact error for every observation.
Only about five percent of the sample score variation is accounted for by this line, so S T R alone does not account for most variation. That matches the broad scatter in the picture. A low R squared does not, by itself, establish statistical insignificance.
final answer
R² ≈ 5.124%; SER ≈ 18.58 score points. The line leaves substantial outcome variation unexplained.
takeaway
R² is a share of sample variation. SER returns residual scatter to the units of the outcome.
12 / 22 · 00:21:08
Q11: Check every interpretation statement
chapter 4 guiding notes.pdf, PDF page 12, printed page 12.
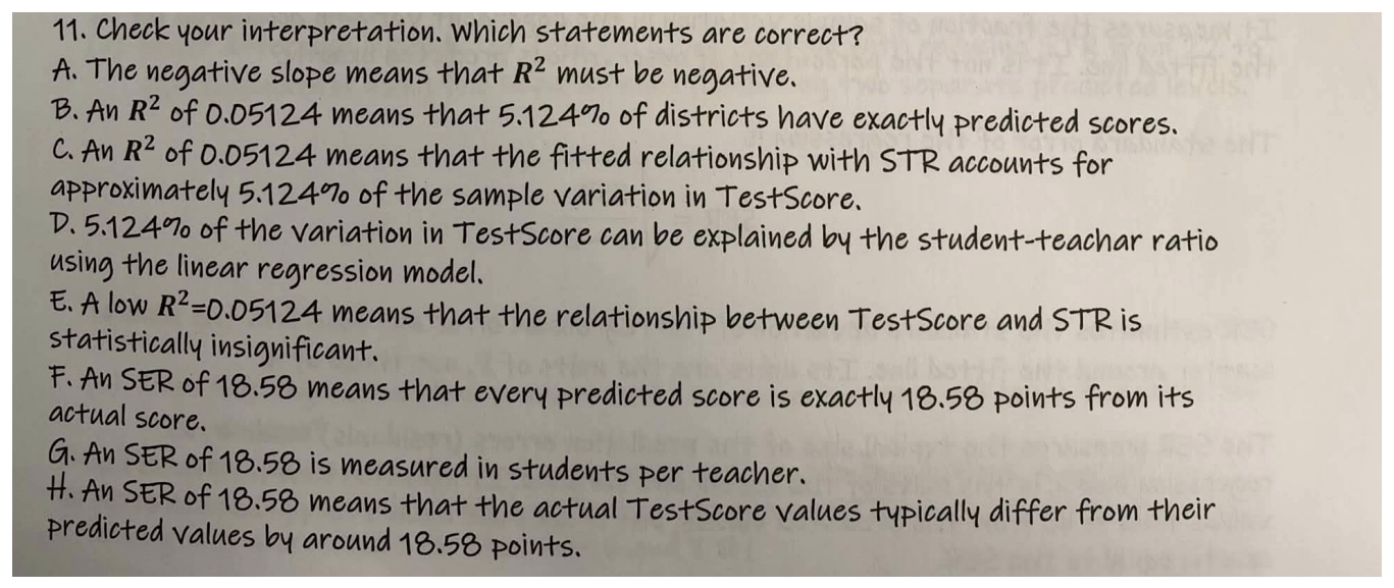
Question Eleven asks which interpretation statements are correct. A says a negative slope means R squared must be negative. B says R squared point zero five one two four means five point one two four percent of districts are predicted exactly. C says that fraction of sample test-score variation is accounted for by the fitted relationship. D says the same variation is explained by the ratio using the linear model. E says a low R squared means the relationship is statistically insignificant. F says S E R eighteen point five eight means every predicted score is exactly that far from the actual score. G gives S E R units as students per teacher. H says actual scores typically differ from predictions by around eighteen point five eight points.
try it first
Name the quantity, choose the method and keep track of the units before opening the solution.
show worked solution
R².05124
SER18.58scorepoints
step by step
A: false — a negative slope does not make R² negative
B: false — R² measures variation, not exact predictions
C: true — about 5.124% of sample variation is accounted for
D: true — “explained” means statistical accounting here
E: false — low R² does not imply an insignificant slope
F: false — individual prediction errors are not all equal
G: false — SER has outcome units: test-score points
H: true — SER describes a typical scale of residual scatter
why it works
A is false: with an intercept, R squared is nonnegative even when the slope is negative. B is false because R squared is a fraction of variation, not a percentage of observations predicted exactly. C is correct. D is also correct when explained means statistical accounting, not proof of causation.
E is false. Fit and statistical significance are different questions. A relationship can account for little variation and still be estimated precisely enough to reject a zero slope.
F is false because S E R summarizes a scale of residual variation; individual misses differ. G is false because S E R uses the units of the outcome, test-score points. H is the intended correct plain-language interpretation of that typical scale. It does not mean S E R equals the average absolute residual.
The correct choices are C, D, and H. Instead of memorizing letters, connect each option to the quantity it describes: variation fraction, prediction error scale, or coefficient uncertainty. Mixing those jobs creates most of the distractors.
final answer
Correct statements: C, D and H. Variation accounted for, typical error scale and coefficient precision are different ideas.
takeaway
Keep fit, individual prediction error and coefficient precision separate when judging statements.
13 / 22 · 00:23:23
Q12(a,b): A cost model with scaled units
chapter 4 guiding notes.pdf, PDF page 13, printed page 13.
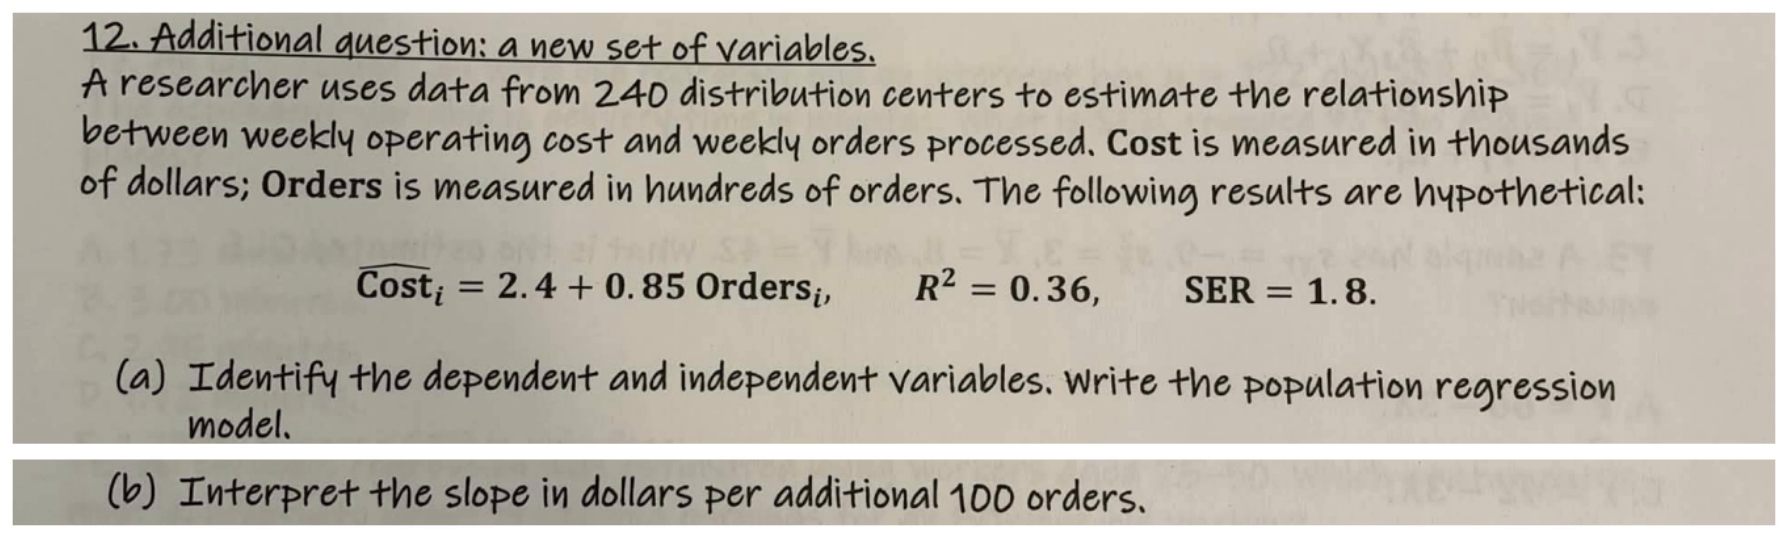
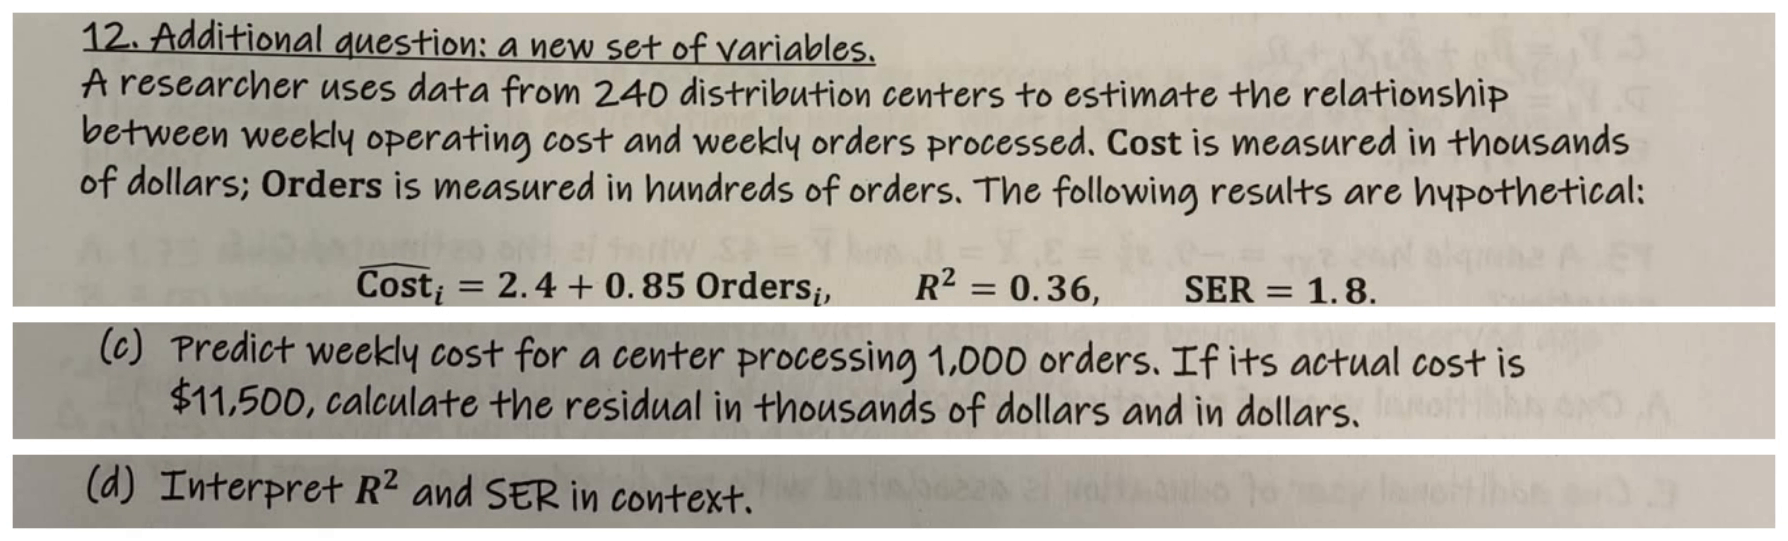
Question Twelve introduces hypothetical regression results for two hundred forty distribution centers. Weekly Cost is measured in thousands of dollars. Weekly Orders is measured in hundreds of orders. The fitted equation is Cost equals two point four plus zero point eight five times Orders, with R squared point three six and S E R one point eight. Part a asks for dependent and independent variables and the population model. Part b asks for the slope in dollars per additional one hundred orders.
try it first
Name the quantity, choose the method and keep track of the units before opening the solution.
show worked solution
Cost$1000
Orders100s
ŷ2.4+.85Orders
R².36,SER1.8,n240
step by step
Y = Cost (thousands of dollars); X = Orders (hundreds)
Cost is Y, the outcome, and Orders is X, the predictor. The population model is Cost for center i equals beta zero plus beta one times Orders for center i, plus u for center i. Do not replace the unknown population coefficients with sample numbers when the question specifically asks for the population model.
One unit of Orders means one hundred actual orders. The slope is zero point eight five in thousand-dollar units, which is eight hundred fifty dollars. So one hundred additional weekly orders are associated with predicted weekly cost eight hundred fifty dollars higher.
This is not eighty-five cents per order and not an eighty-five-percent change. The units are essential inputs. Before doing any substitution, write a small conversion reminder: one X unit is one hundred orders, and one Y unit is one thousand dollars.
The assumptions paragraph above the question explains why a fitted association is not automatically causal. Conditional mean zero means that other influences left in the error do not systematically push outcomes up or down at particular X values, on average. Independently and identically distributed pairs means the observations are sampled independently from the same underlying distribution. It does not mean X and Y within a pair must be unrelated. The third assumption says very large outliers are unlikely, so a few extreme observations should not dominate. Your notes do not require fourth-moment calculations or proofs here. Simply running software does not verify these conditions.
final answer
Cost is Y; Orders is X. Another 100 weekly orders is associated with predicted cost $850 higher.
takeaway
Translate the model’s scaled units into real quantities before interpreting its slope.
14 / 22 · 00:25:52
Q12(c,d): Cost prediction, residual, and fit
chapter 4 guiding notes.pdf, PDF page 13, printed page 13.
Continuing Question Twelve, the fitted equation is Cost equals two point four plus zero point eight five times Orders. Cost is measured in thousands of dollars and Orders in hundreds of orders. Part c asks for predicted weekly cost for a center processing one thousand orders. Its actual cost is eleven thousand five hundred dollars. Calculate the residual in thousands of dollars and in dollars. Part d asks for interpretations of R squared point three six and S E R one point eight in this context.
try it first
Name the quantity, choose the method and keep track of the units before opening the solution.
R² = 0.36: 36% of sample Cost variation accounted for
SER = 1.8 thousand dollars = $1,800
why it works
One thousand orders equals ten hundreds of orders, so X is ten, not one thousand. Substitute ten: two point four plus zero point eight five times ten equals ten point nine. That means ten thousand nine hundred dollars.
Actual cost is eleven point five thousand dollars. Subtract predicted cost ten point nine thousand to get a positive zero point six thousand dollars, or positive six hundred dollars. Actual cost is above the fitted value, so the model underpredicts this center.
For part d, R squared point three six means the fitted relationship with Orders accounts for thirty-six percent of the sample variation in weekly Cost. It does not mean thirty-six percent of centers are predicted exactly. S E R one point eight means the typical scale of residual variation is one point eight thousand dollars, or eighteen hundred dollars. It is not one point eight percent, and it does not say every center has exactly that error.
The calculations are simple once the units are handled. The main skill is noticing that the numbers fed into the model are scaled versions of the everyday quantities.
final answer
Prediction: $10,900. Residual: +$600. R²: 36% of variation; SER: $1,800.
takeaway
Convert units before substituting, then convert the prediction and residual back to dollars.
15 / 22 · 00:27:53
Practice P1: Choose dependent and independent variables
chapter 4 additional material.pdf, PDF page 2, printed page 14.
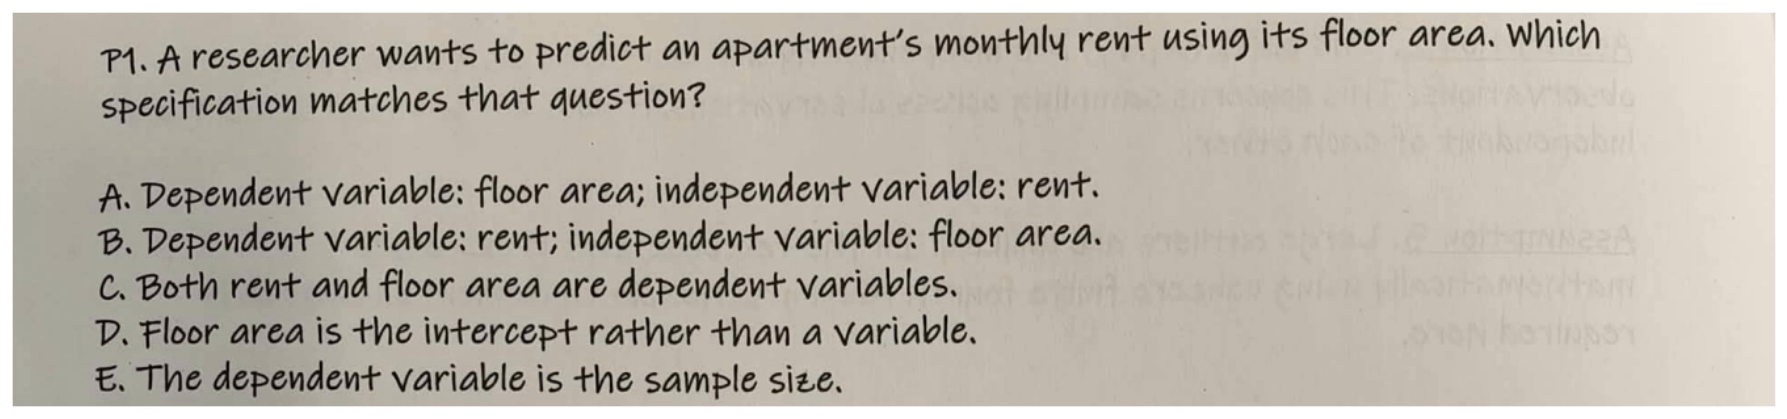
Practice P One asks: a researcher wants to predict an apartment's monthly rent using its floor area. Which specification matches that question? The choices swap rent and floor area, call both dependent variables, call floor area an intercept, or call the dependent variable the sample size.
try it first
Name the quantity, choose the method and keep track of the units before opening the solution.
show worked solution
Predictmonthlyrentusingfloorarea
step by step
Y = monthly rent
X = floor area
why it works
The target is monthly rent. That is the dependent variable, Y. The clue used to predict it is floor area, the independent variable, X. Choose B.
The word using is a useful signal. Predict Y using X. Reversing the variables would answer a different prediction question, even though the two measurements might be related. An intercept is a coefficient, not the predictor itself. Sample size tells us how many observations we have, not what outcome is being predicted.
Say the sentence before memorizing the letters: monthly rent is predicted from floor area.
final answer
B — predict monthly rent using floor area.
takeaway
The thing you want to predict is Y; the information you use is X.
16 / 22 · 00:29:04
Practice P2: Identify the fitted-value equation
chapter 4 additional material.pdf, PDF page 2, printed page 14.
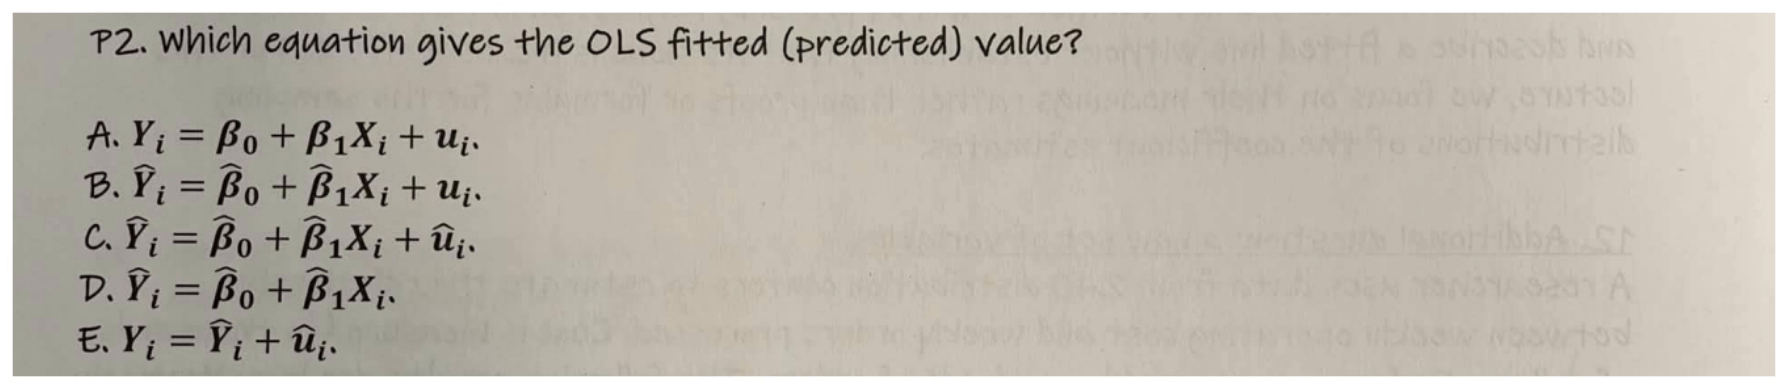
Practice P Two asks which equation gives the O L S fitted or predicted value. The choices include the population model with u, fitted equations with error terms added, the fitted line without an error, and the identity that actual Y equals fitted Y plus its residual. Which one is the prediction itself?
try it first
Name the quantity, choose the method and keep track of the units before opening the solution.
show worked solution
FiveequationchoicesA–E
step by step
Ŷᵢ = β̂₀ + β̂₁Xᵢ
The fitted prediction has no added uᵢ or ûᵢ
why it works
Y hat equals estimated beta zero plus estimated beta one times X. The hats matter. This is the sample-based line's prediction.
The population equation with unknown beta values and u describes actual outcomes in the population model, not the fitted value. Adding a population error or sample residual to the right side changes the meaning. Actual Y equals Y hat plus the residual is a valid identity, but it is not the requested equation for the prediction itself.
A practical check is to ask whether the equation gives a prediction using X and estimated coefficients alone. If it requires knowing the observation's unexplained error, it is not the fitted-value rule.
Therefore, choose D.
final answer
D — Ŷᵢ = β̂₀ + β̂₁Xᵢ.
takeaway
A fitted-value equation contains estimated coefficients and X, with no added error term.
17 / 22 · 00:30:26
Practice P3: Estimate a line from four statistics
chapter 4 additional material.pdf, PDF page 2, printed page 14.
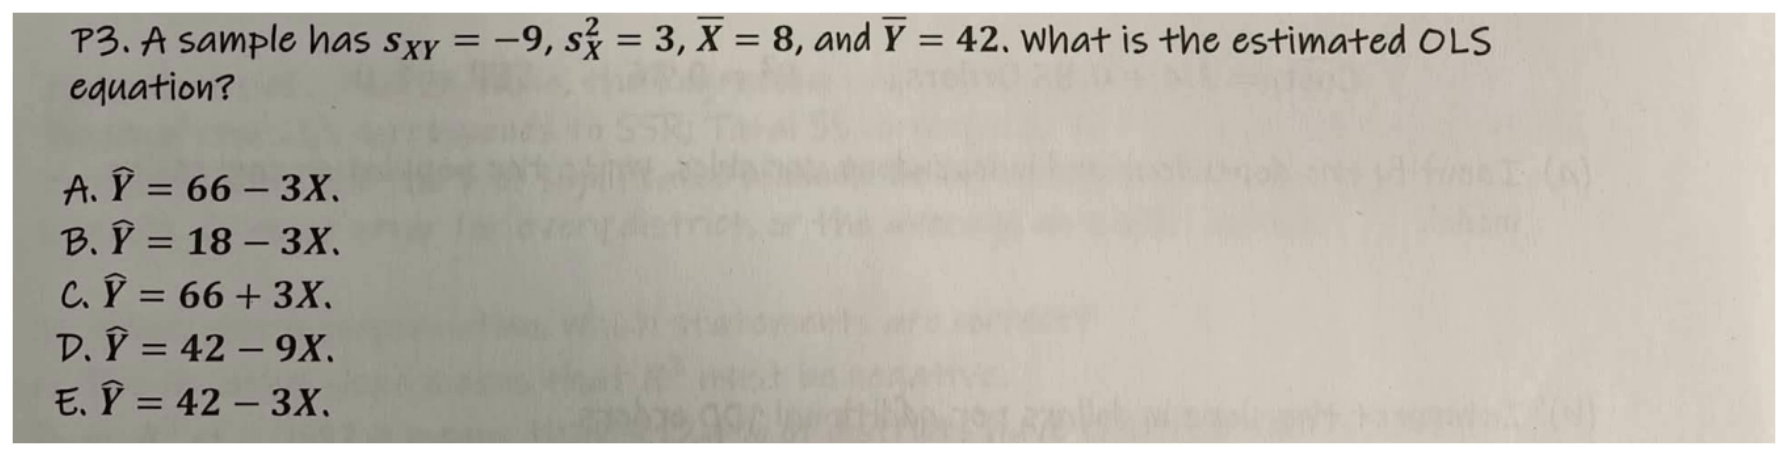
Practice P Three gives sample covariance negative nine, sample variance of X equal to three, mean X equal to eight, and mean Y equal to forty-two. It asks for the estimated O L S equation. The choices differ in slope signs and intercepts.
try it first
Name the quantity, choose the method and keep track of the units before opening the solution.
show worked solution
sXY−9
sX²3
Xbar8
Ybar42
step by step
β̂₁ = −9 / 3 = −3
β̂₀ = 42 − (−3)(8) = 66; Ŷ = 66 − 3X
Check: 66 − 3(8) = 42 = Ȳ
why it works
First calculate the slope: negative nine divided by three equals negative three. This immediately eliminates choices with positive three, negative nine, or other slopes.
Then compute the intercept using mean Y minus the estimated slope times mean X. Forty-two minus negative three times eight is forty-two minus negative twenty-four, which equals sixty-six. The line is Y hat equals sixty-six minus three X, choice A.
Check it at the sample mean X of eight. Sixty-six minus twenty-four equals forty-two, which matches mean Y. That is a useful verification because an O L S line with an intercept passes through the two sample means.
Do not stop after finding the slope, and do not lose the double negative while calculating the intercept.
final answer
A — Ŷ = 66 − 3X; the line passes through (8, 42).
takeaway
An OLS line with an intercept passes through the sample means. Use that as a check.
18 / 22 · 00:31:46
Practice P4: Interpret an education slope in dollars
chapter 4 additional material.pdf, PDF page 2, printed page 14.
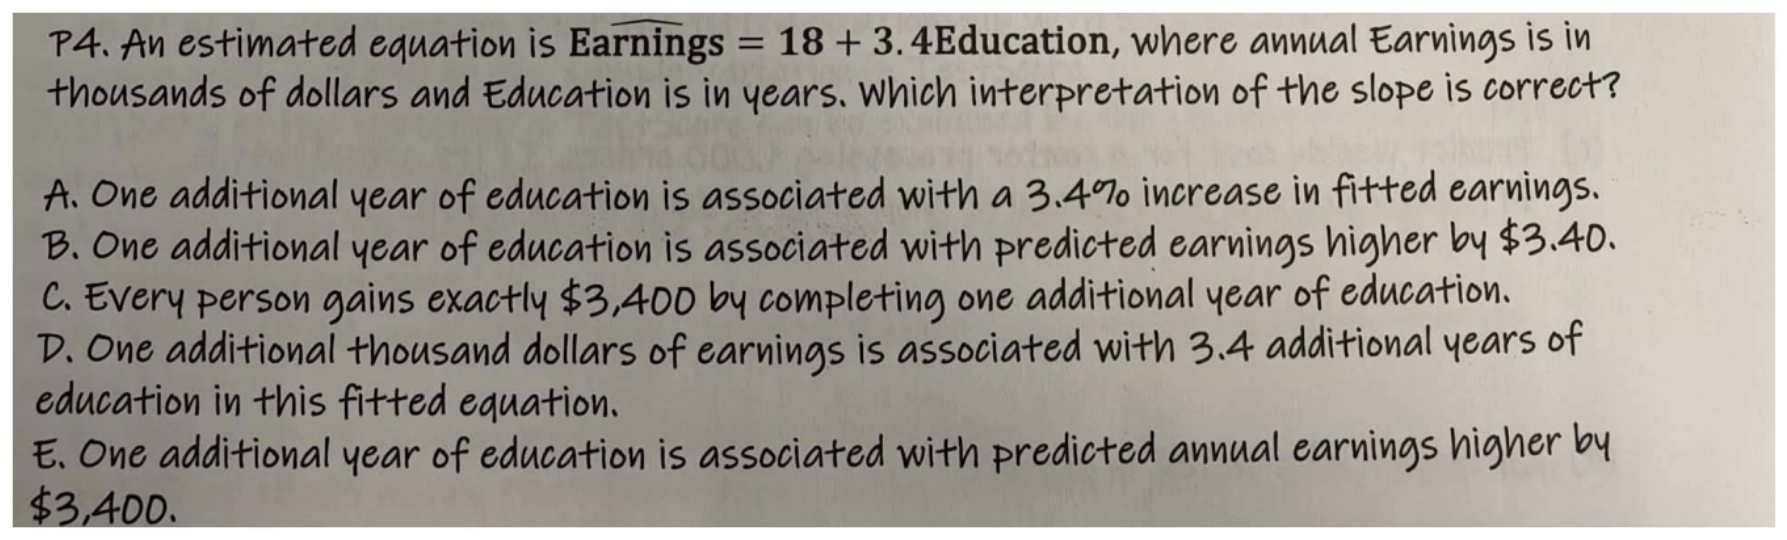
Practice P Four gives predicted annual Earnings equal to eighteen plus three point four times Education. Earnings is measured in thousands of dollars and Education in years. Which slope interpretation is correct? The options include a three point four-percent increase, three dollars forty cents, an exact gain for every person, the reversed relationship, and predicted annual earnings higher by three thousand four hundred dollars.
try it first
Name the quantity, choose the method and keep track of the units before opening the solution.
show worked solution
Earnings$1000
Educationyears
Slope3.4
step by step
+1 year of Education → fitted Earnings +3.4 thousand dollars
3.4 thousand = $3,400
Interpret as a predicted annual earnings association
why it works
The slope says that increasing Education by one year is associated with an increase of three point four in fitted Earnings. Because Earnings is in thousands, three point four means three thousand four hundred dollars. Choose E.
The equation is in levels, not logarithms or percentage units, so the slope is not three point four percent. It also does not establish that every person gains exactly that amount by adding one year of education. We are describing a fitted average association, and causal interpretation would need additional support.
The option that reverses earnings and education describes a different regression. Keep the direction of prediction straight: education is the input, earnings is the outcome. A good answer names the increase in X, the change in predicted Y, and both units.
final answer
E — one additional year of education is associated with fitted annual earnings $3,400 higher.
takeaway
A coefficient measured in thousands must be multiplied by 1,000 when reported in dollars.
19 / 22 · 00:33:20
Practice P5: Use the means property
chapter 4 additional material.pdf, PDF page 1, printed page 15.
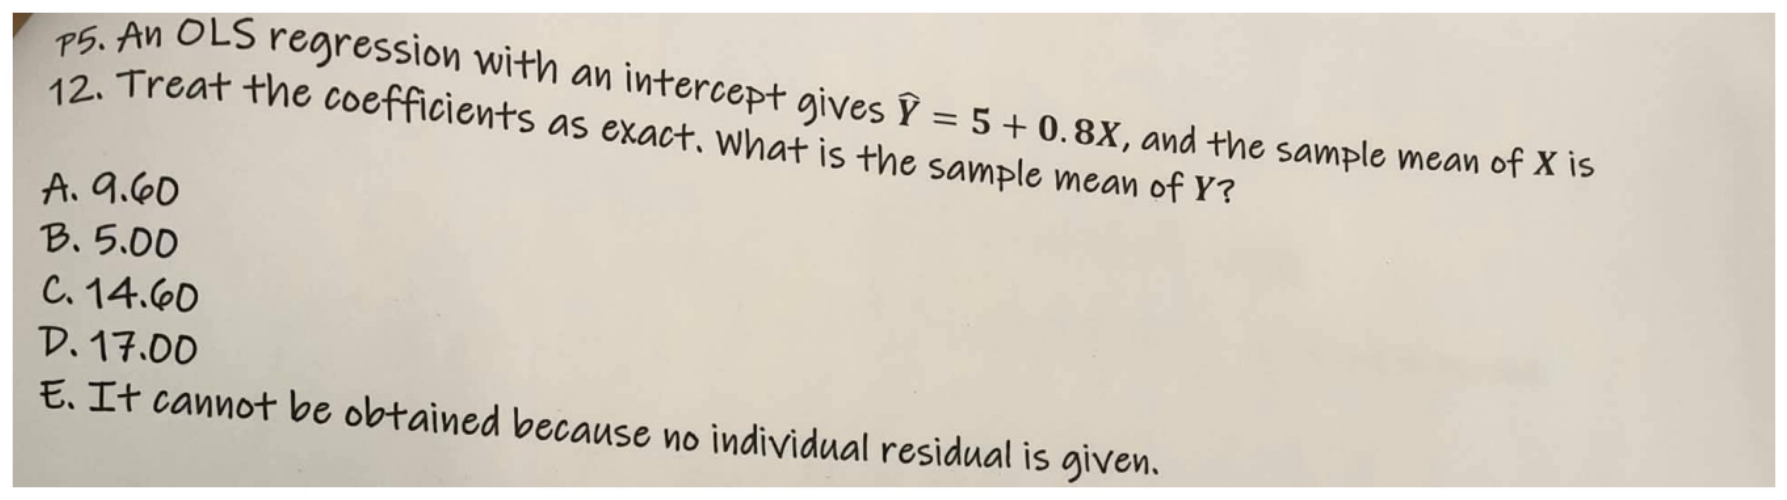
Practice P Five says an O L S regression with an intercept gives predicted Y equal to five plus zero point eight X. The sample mean of X is twelve. Treat the coefficients as exact. What is the sample mean of Y?
try it first
Name the quantity, choose the method and keep track of the units before opening the solution.
show worked solution
ŷ5+.8X
Xbar12
OLSwithintercept
step by step
Ȳ = 5 + 0.8(12) = 14.60
why it works
Because the model includes an intercept, its fitted line passes through mean X and mean Y. Substitute mean X, twelve, into the equation. Five plus zero point eight times twelve is five plus nine point six, giving fourteen point six. The answer is C, fourteen point six zero.
We do not need an individual observation's residual. The property applies to the sample means, and the question tells us to treat the coefficients as exact, avoiding rounding ambiguity. The average fitted value equals the average actual Y in this setting.
Be careful not to return only nine point six, which omits the intercept, or five, which ignores the slope term. The words with an intercept are important because they support this means property.
final answer
C — mean Y = 14.60.
takeaway
The means property lets you recover the sample mean outcome from the fitted equation.
20 / 22 · 00:34:38
Practice P6: Negative correlation and R squared
chapter 4 additional material.pdf, PDF page 1, printed page 15.
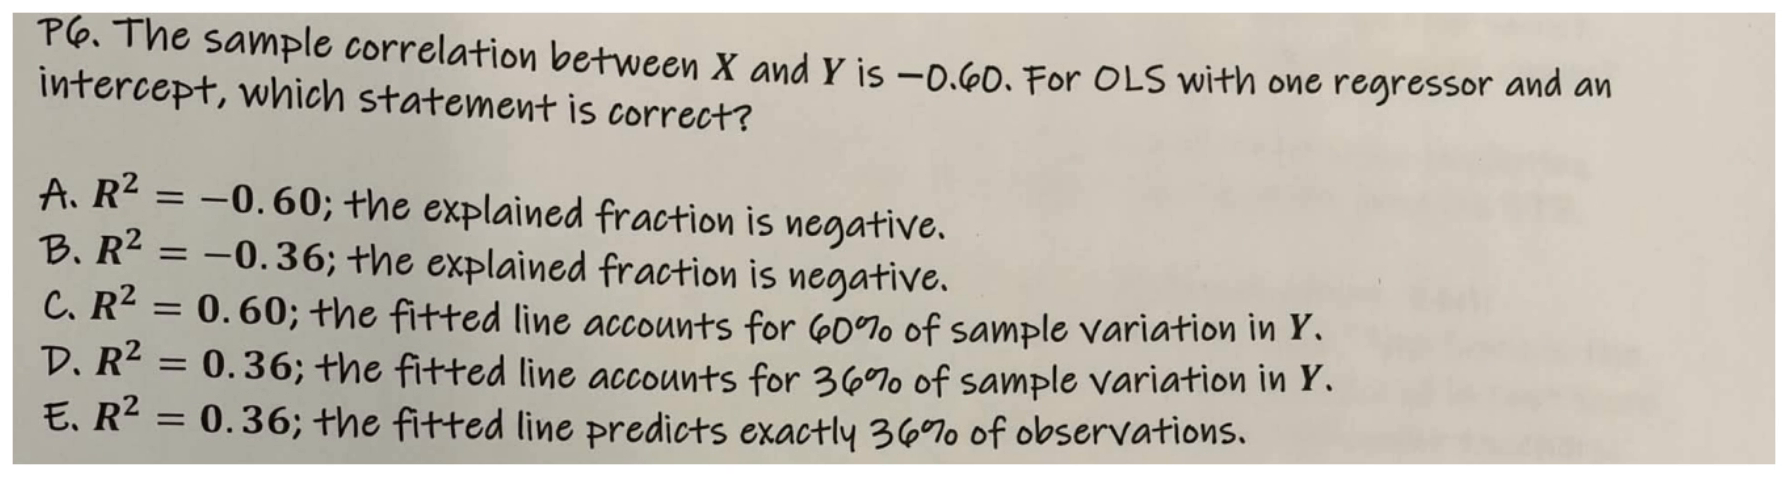
Practice P Six gives a sample correlation between X and Y of negative zero point six zero. For O L S with one regressor and an intercept, which statement about R squared is correct? The choices include negative R squared values, sixty percent of variation, thirty-six percent of variation, and exactly thirty-six percent of observations predicted.
try it first
Name the quantity, choose the method and keep track of the units before opening the solution.
show worked solution
r−.60
OneXwithintercept
step by step
R² = (−0.60)² = 0.36
36% of sample variation is accounted for by the fitted line
why it works
Square the correlation. Negative zero point six times negative zero point six equals positive zero point three six. Choose D: the fitted line accounts for thirty-six percent of the sample variation in Y.
Squaring removes the sign, so R squared cannot tell us whether the relationship slopes upward or downward. The sign belongs to the correlation or slope. Also, zero point three six is a fraction of variation, not the fraction of data points predicted perfectly.
This shortcut relies on the stated setting, one regressor and an intercept. Do not generalize it to every regression situation without checking the conditions. Here, those conditions are explicitly given, so the calculation is immediate.
final answer
D — R² = 0.36: 36% of sample variation accounted for.
takeaway
In a simple regression with an intercept, squaring correlation removes its sign in R².
21 / 22 · 00:36:04
Practice P7: Compute SER and keep its units
chapter 4 additional material.pdf, PDF page 1, printed page 15.
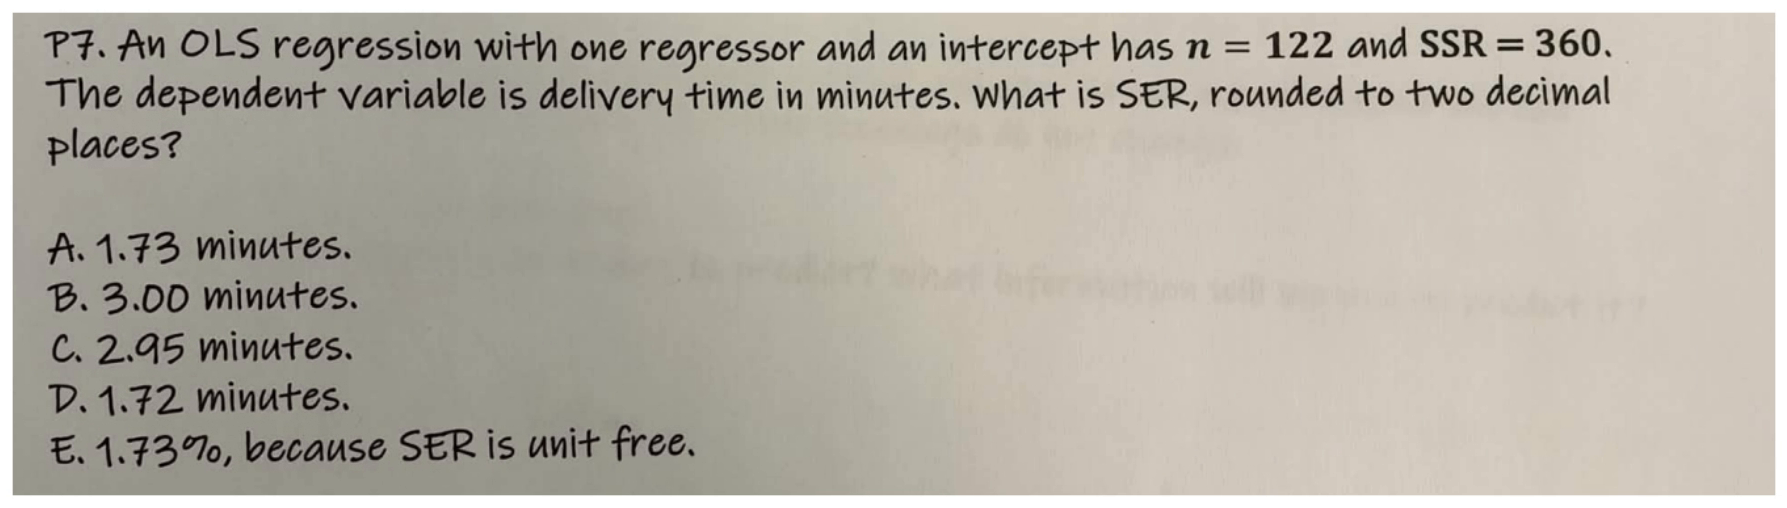
Practice P Seven describes an O L S regression with one regressor and an intercept, one hundred twenty-two observations, and residual sum of squares three hundred sixty. The dependent variable is delivery time in minutes. What is S E R, rounded to two decimal places?
try it first
Name the quantity, choose the method and keep track of the units before opening the solution.
show worked solution
n122
SSR360
Yminutes
step by step
n − 2 = 122 − 2 = 120
SSR / (n − 2) = 360 / 120 = 3
SER = √3 ≈ 1.73 minutes
why it works
We estimated two coefficients, an intercept and a slope, so the denominator is one hundred twenty-two minus two, which is one hundred twenty. Divide three hundred sixty by one hundred twenty and get three. Then take the square root: approximately one point seven three.
The answer is A, one point seven three minutes. The value three is the quantity inside the square root, not the S E R itself. Dividing by n rather than n minus two would use the wrong formula for this question. Reporting a percentage would also be wrong: S E R uses the dependent variable's units, and delivery time is measured in minutes.
It describes a typical scale of residual scatter. It does not say every delivery is exactly one point seven three minutes from its prediction.
final answer
A — SER ≈ 1.73 minutes.
takeaway
SER uses residual variation divided by n − 2 and has the outcome’s units.
22 / 22 · 00:37:26
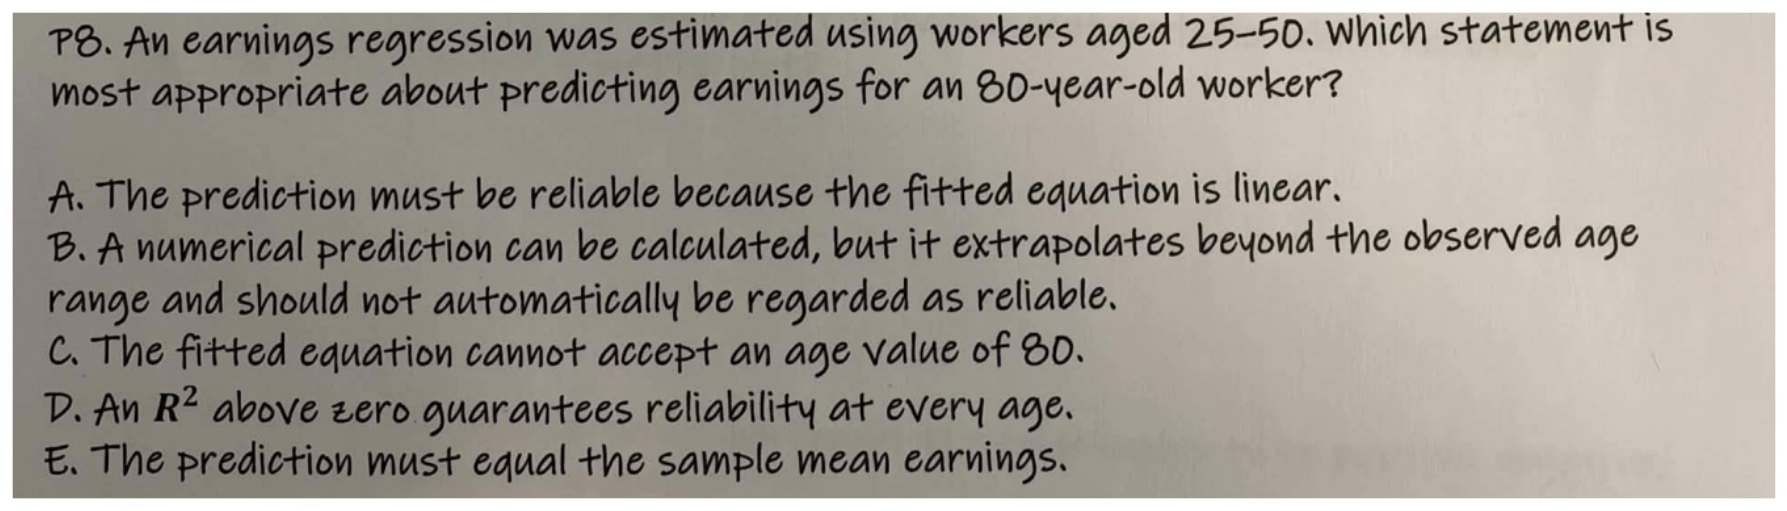
Practice P8: Can we extrapolate to age eighty?
chapter 4 additional material.pdf, PDF page 1, printed page 15.
Practice P Eight says an earnings regression was estimated using workers aged twenty-five to fifty. Which statement is most appropriate about predicting earnings for an eighty-year-old worker? The alternatives say the linear form guarantees reliability, a number can be calculated but it is extrapolation, the equation cannot accept eighty, a positive R squared guarantees reliability, or the prediction must equal sample mean earnings.
try it first
Name the quantity, choose the method and keep track of the units before opening the solution.
show worked solution
Estimationages25–50
Newage80
step by step
Age 80 is outside the sample range 25–50
A numerical prediction can be calculated
Reliability outside the observed range is not guaranteed
why it works
You can substitute eighty into a linear equation and obtain a numerical prediction. But eighty lies outside the ages used to estimate the relationship, so this is extrapolation. The same relationship may not continue into that range.
Neither a straight-line formula nor an R squared above zero guarantees reliability at every age. The equation does not refuse the number eighty; the issue is evidence, not arithmetic. There is also no reason its prediction must equal the sample mean.
This final Chapter Four practice question reinforces a broader habit: ask whether your calculation answers a meaningful, supported question. A correct numerical operation can still produce an unjustified conclusion. Next we will examine a different kind of uncertainty: how coefficient estimates change when the sample changes.
The correct choice is B.
final answer
B — the formula accepts 80, but this extrapolation is not automatically reliable.
takeaway
A formula can produce a number outside the sample range without making it a reliable prediction.