33 navigation sections · original questions, worked solutions and the reason behind each step.
An independent study aid, not an instructor answer key. Some navigation sections group subparts or explain standard-error concepts; these are not 33 separate questions.
related video title: ECO 4000 Chapter 5 — Complete PDF Question Walkthrough
Question images are lossless crops of the original excerpts as displayed in the video. Open an image full-size to read its smallest details. The “read the question in words” version follows the transcript.
33 sections
01 / 33 · 00:00:00
Activity 1(a): Population slope versus sample slope
chapter 5 guiding notes.pdf, PDF page 1, printed page 1.
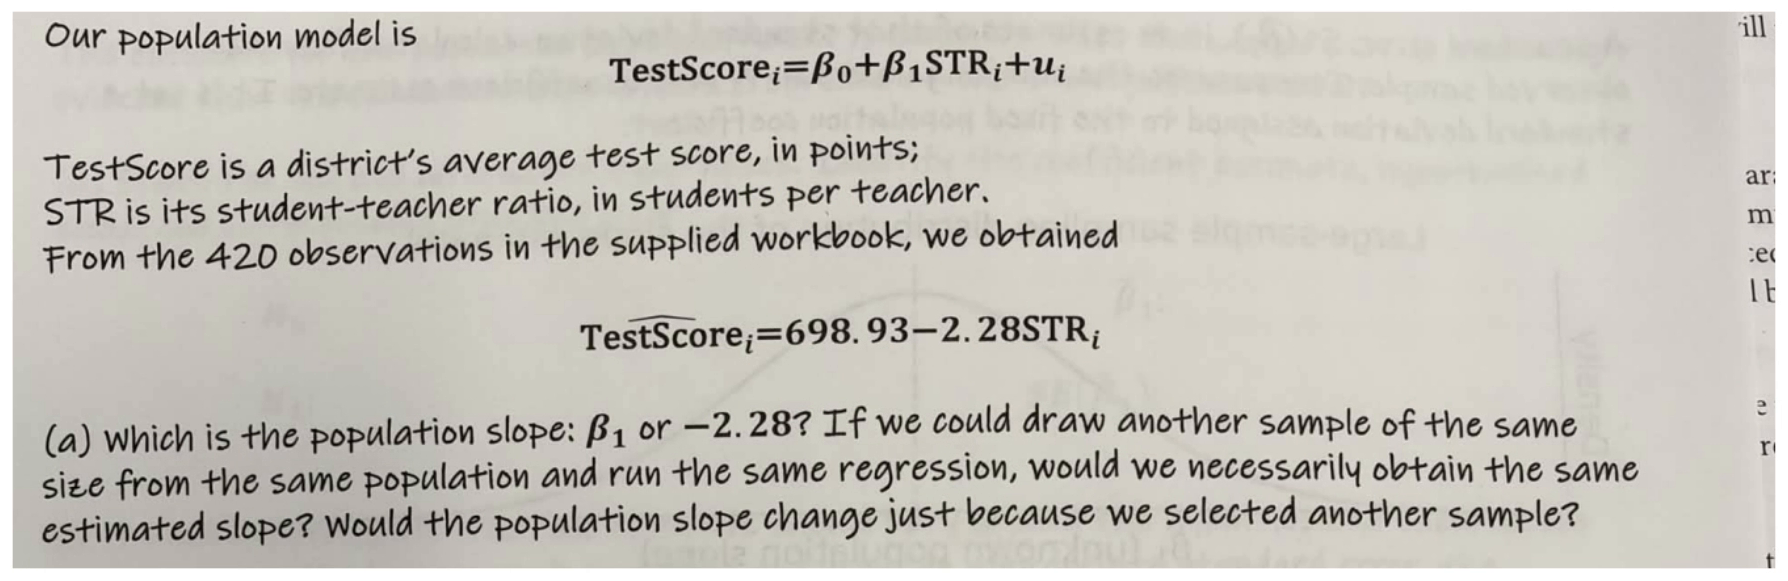
Read Activity One, part A, with the two equations visible. The population model says a district's test score equals beta zero plus beta one times its student-to-teacher ratio, plus an error. The sample of four hundred twenty districts gives a fitted slope of negative two point two eight. The question asks which number is the population slope, whether another sample must give the same estimate, and whether the population slope itself changes.
try it first
Name the quantity, choose the method and keep track of the units before opening the solution.
show worked solution
Population slope β₁ is unknown.
Sample fitted slope β̂₁ = −2.28.
n = 420 school districts.
step by step
Identify β₁ in population equation, with no hat.
Identify β̂₁ = −2.28 in fitted equation.
New random sample can change β̂₁, not the fixed β₁ merely because of sampling.
why it works
The population slope is beta one. It is the unknown number we want to learn about. Negative two point two eight is beta one hat, the estimate from this sample. The hat means estimated, not a different population.
Another sample could give a different estimate, even with four hundred twenty observations again. Different districts can produce a different fitted line. But choosing a new sample does not, by itself, change the underlying population relationship. Think of repeated measurements of one fixed target: the measurements move around, while the target stays put.
final answer
Population slope: β₁. Another same-size sample need not give −2.28; the population slope does not change merely because the sample changes.
takeaway
This is a population-versus-sample distinction, not a calculation.
02 / 33 · 00:01:14
Activity 1(b): Shape, center, and spread
chapter 5 guiding notes.pdf, PDF page 1, printed page 1.
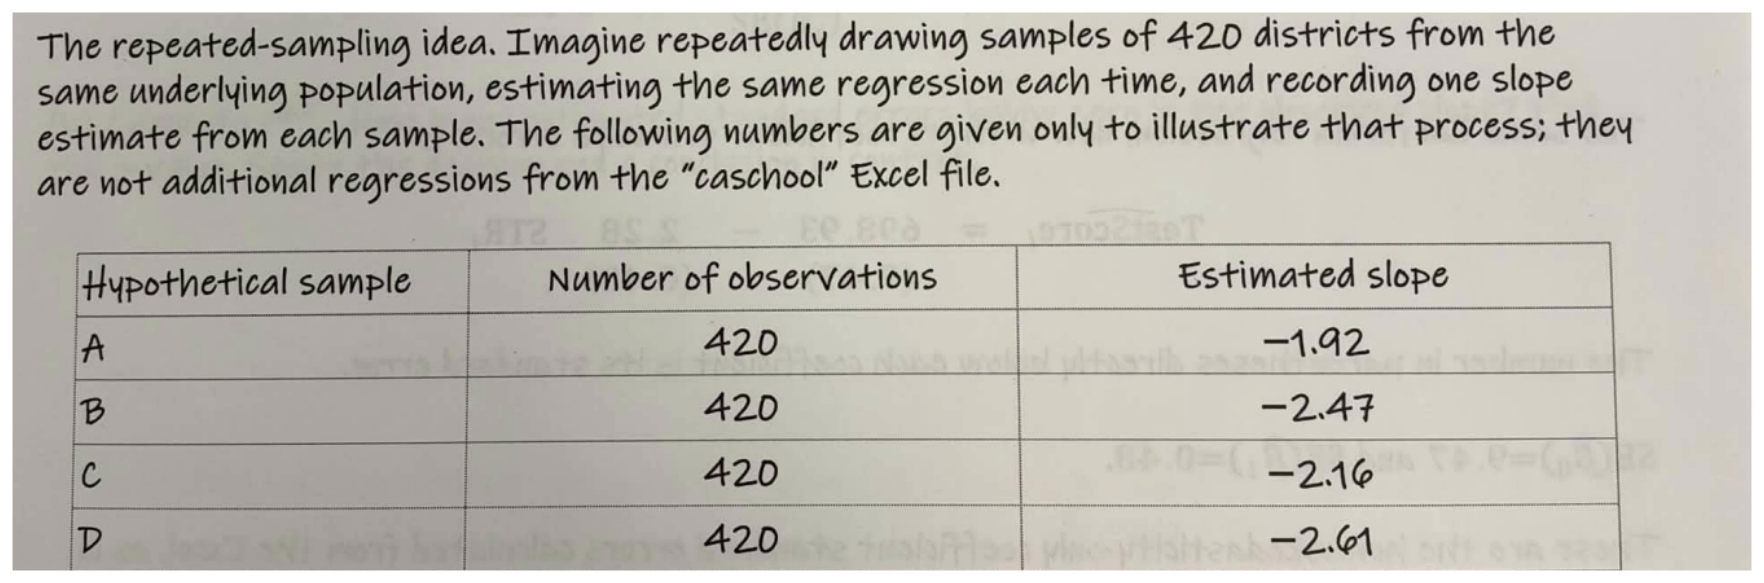
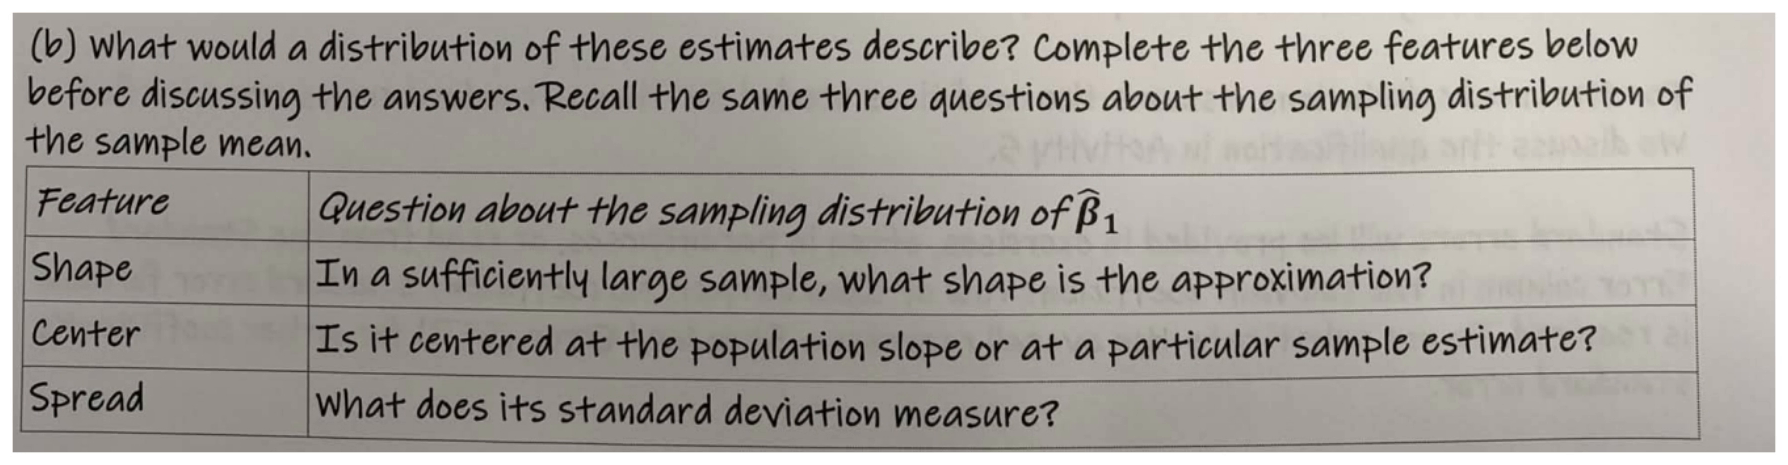
Part B asks us to imagine many samples of four hundred twenty districts, not many outcomes inside one district. The four illustrative slopes are negative one point nine two, negative two point four seven, negative two point one six, and negative two point six one. What would a distribution of such estimates describe? The worksheet asks for its shape, center, and spread.
try it first
Name the quantity, choose the method and keep track of the units before opening the solution.
show worked solution
Every hypothetical sample has n=420.
Slopes: −1.92, −2.47, −2.16, −2.61.
step by step
Object distributed: β̂₁ across repeated samples.
Shape: approximately normal under the stated large-sample conditions.
Center: fixed β₁.
Spread: SD of β̂₁; estimated by SE(β̂₁).
why it works
Its shape is approximately bell-shaped in a sufficiently large sample, under the relevant least-squares assumptions. Its center is the fixed population slope, beta one. We do not automatically center it at negative two point two eight just because that was our observed estimate.
Its spread measures how much estimated slopes vary from sample to sample. A narrow spread means samples tend to produce similar estimates; a wider spread means more sampling uncertainty.
These four numbers illustrate the idea. Do not average them and announce that you have discovered the true slope. They are not four new verified regressions or the full sampling distribution.
final answer
Approximately normal; centered at population β₁; spread describes sample-to-sample variation in the slope estimator.
takeaway
A sampling distribution describes the estimator across repeated samples.
03 / 33 · 00:02:30
Read the coefficient standard errors
chapter 5 guiding notes.pdf, PDF page 2, printed page 2.
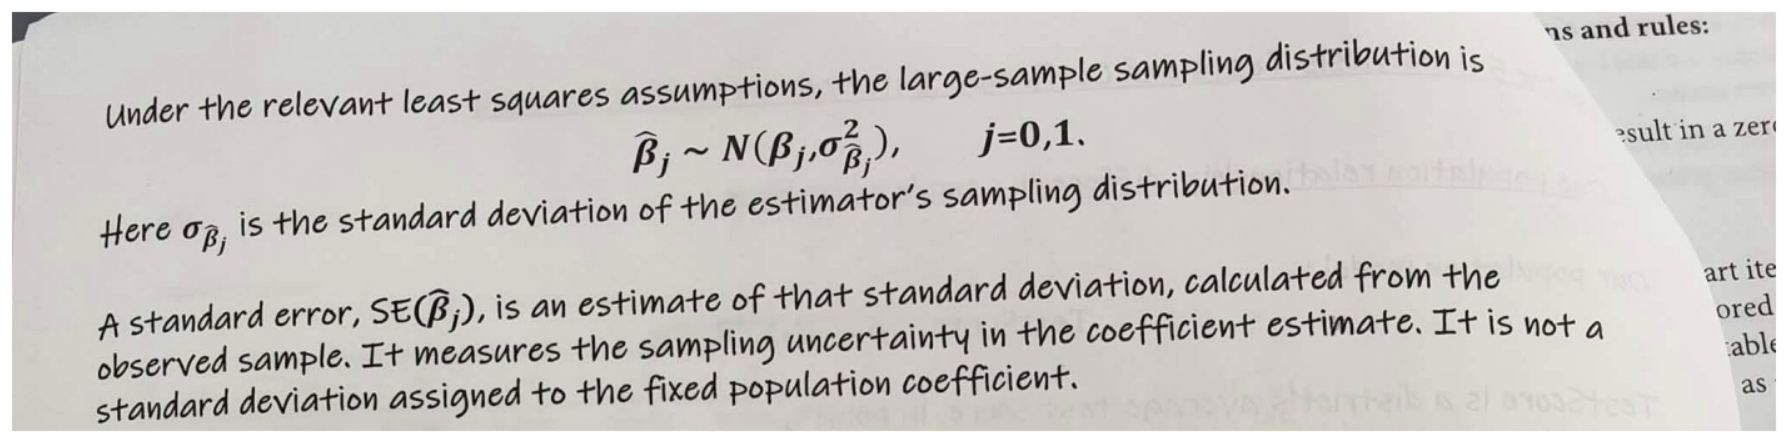
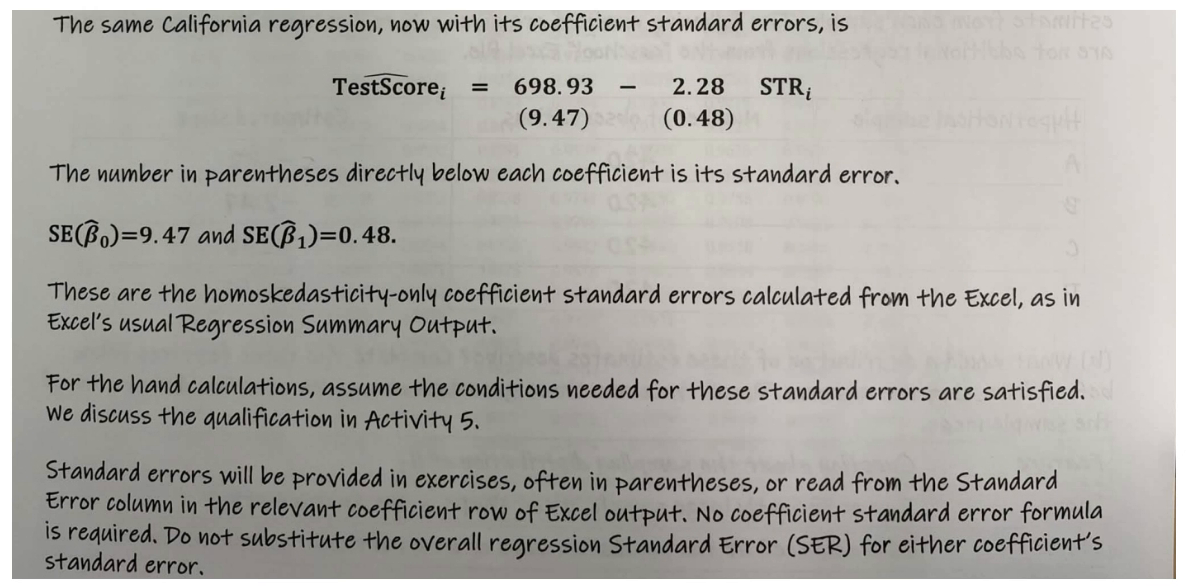
Before calculating a test, read the next PDF page carefully. It asks us to understand what a coefficient standard error measures. The population coefficient is fixed but unknown. Estimates from repeated samples move around it. The standard error uses our observed sample to estimate the size of that movement.
try it first
Name the quantity, choose the method and keep track of the units before opening the solution.
show worked solution
Intercept 698.93 has SE 9.47.
Slope −2.28 has SE 0.48.
The page refers to an Activity 5 qualification; printed p7 is not supplied.
step by step
Match coefficient with number directly below it.
Use 0.48 for slope tests and intervals.
Use 9.47 for intercept tests and intervals.
Do not substitute SER.
why it works
Now look directly below the fitted equation. Under six hundred ninety-eight point nine three is nine point four seven. That is the intercept's standard error. Under negative two point two eight is zero point four eight. That is the slope's standard error. Read each coefficient vertically with its own number in parentheses.
These are not the overall standard error of the regression, or S E R. S E R describes the scatter of outcomes around the fitted line. A coefficient standard error describes uncertainty in an estimated coefficient. They do different jobs.
The notes specify ordinary Excel, homoskedasticity-only standard errors here, and ask us to assume their conditions hold for these hand calculations. We use the provided errors rather than derive a new formula. Later, we will examine what happens when the standard-error method needs to change.
final answer
SE(β̂₀)=9.47; SE(β̂₁)=0.48. A coefficient SE estimates sampling uncertainty, not outcome scatter.
takeaway
Every later test divides by the SE belonging to the coefficient being tested.
04 / 33 · 00:03:50
Activity 2(a): Set up the zero-slope test
chapter 5 guiding notes.pdf, PDF page 3, printed page 3.
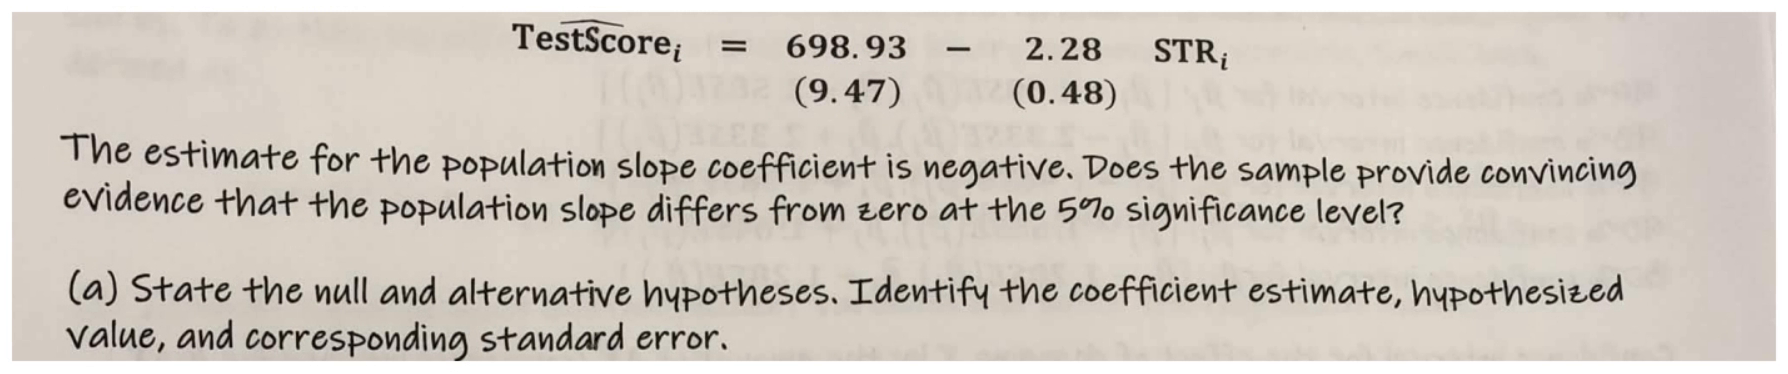
Activity Two shows the school regression again: estimated slope negative two point two eight, with slope standard error zero point four eight. It asks whether the population slope differs from zero at the five-percent significance level. Part A asks us to state the hypotheses and identify the estimate, claimed value, and correct standard error.
try it first
Name the quantity, choose the method and keep track of the units before opening the solution.
show worked solution
β̂₁=−2.28; SE(β̂₁)=0.48.
Null reference value 0; significance level α=0.05.
step by step
H₀: β₁=0.
H₁: β₁≠0.
Estimate −2.28; null value 0; matching SE 0.48.
why it works
The phrase differs from is our direction clue. A slope either above or below zero would count as a departure, so this is a two-sided test. Write the null as beta one equals zero and the alternative as beta one does not equal zero. These claims concern the population slope, without a hat.
Next, label the three numbers we will use: estimate negative two point two eight; hypothesized value zero; slope standard error zero point four eight. Do not use nine point four seven, because that belongs to the intercept.
The estimate happens to be negative, but that does not change the question into a one-sided test. The question's wording, not the sign we observed, determines the alternative.
final answer
H₀: β₁=0 versus H₁: β₁≠0; β̂₁=−2.28, hypothesized value 0, SE=0.48.
takeaway
“Differs from” requires a two-sided test of the population slope.
05 / 33 · 00:05:07
Activity 2(b): Statistic, p-value, and conclusion
chapter 5 guiding notes.pdf, PDF page 3, printed page 3.
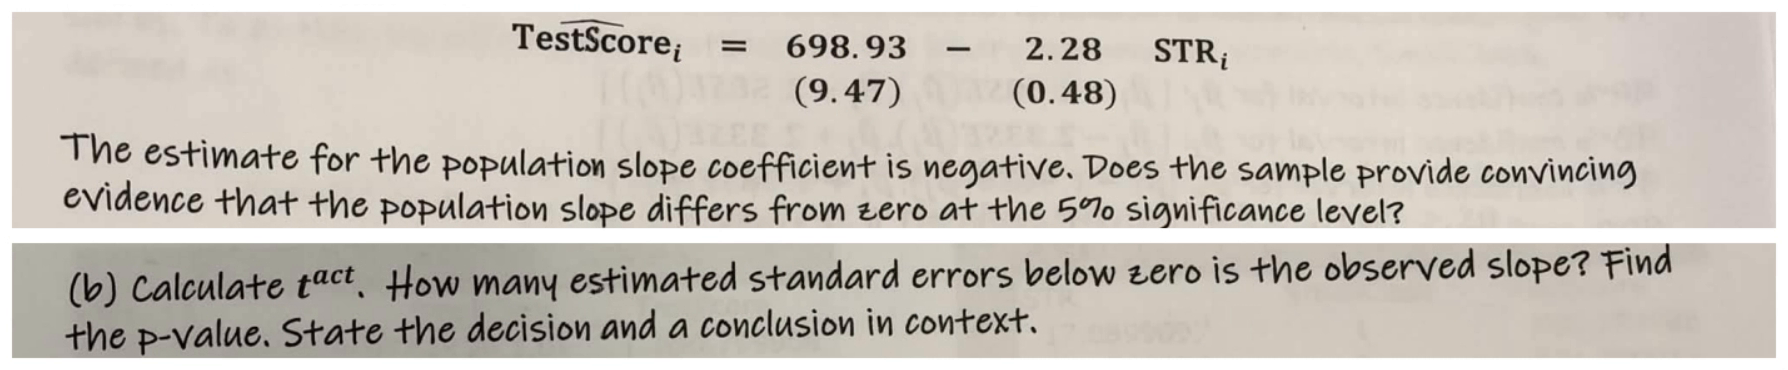
Part B now asks for five things: the test statistic, the distance below zero in standard-error units, the p-value, the decision, and a school-district interpretation. Our estimate is negative two point two eight, our null value is zero, and the slope standard error is zero point four eight. This is the same two-sided test at the five-percent significance level.
try it first
Name the quantity, choose the method and keep track of the units before opening the solution.
show worked solution
Estimate −2.28; null 0; SE 0.48.
H₁: β₁≠0; large-sample standard-normal method.
step by step
t=(−2.28−0)/0.48=−4.75.
Distance: 4.75 estimated SEs below zero.
p=2P(Z>4.75)≈0.000002034.
p<0.05, so reject H₀.
Conclude evidence of negative population association, not automatic causation.
why it works
Subtract the claimed value from the estimate, then divide by the standard error. Negative two point two eight divided by zero point four eight is negative four point seven five. The estimate is four point seven five estimated standard errors below zero.
Because the alternative is two-sided, count unusual results in both tails of the standard normal curve. The p-value is about two millionths, which is far below point zero five. It is extremely small, not literally zero. Equivalently, the absolute statistic, four point seven five, exceeds the five-percent cutoff one point nine six.
Reject the null. The data provide evidence of a nonzero, negative population relationship between the student-to-teacher ratio and average test score, under the stated conditions. This does not by itself prove causation or say the relationship is large enough to matter in practice.
final answer
t=−4.75; two-sided p≈0.000002034; reject H₀ at 5%.
takeaway
Standardizing the distance from the null lets us judge it against sampling uncertainty.
06 / 33 · 00:06:39
Activity 3(a): Build and interpret the slope interval
chapter 5 guiding notes.pdf, PDF page 4, printed page 4.
Activity Three, part A, asks for a ninety-five-percent interval for the population slope, an interpretation, and a comparison with our two-sided test. The estimate is negative two point two eight and its standard error is zero point four eight. The worksheet gives a ninety-five-percent critical value of one point nine six.
try it first
Name the quantity, choose the method and keep track of the units before opening the solution.
Units: test-score points per additional student per teacher.
Zero excluded: agrees with rejection at 5% two-sided.
why it works
First calculate the margin: one point nine six times zero point four eight equals zero point nine four zero eight. Subtract that margin from negative two point two eight to get negative three point two two zero eight. Add it to get negative one point three three nine two. Rounded to two decimals, the interval is negative three point two two to negative one point three four points per additional student per teacher.
This is a range for the population slope, not for individual districts' scores. The ninety-five-percent confidence level describes a method that captures the true coefficient in about ninety-five percent of repeated samples.
Zero is outside this interval. That agrees with rejecting the zero-slope null in the matching five-percent two-sided test. Keep the method and standard error the same when making that connection.
final answer
95% CI [−3.2208,−1.3392], approximately [−3.22,−1.34]; excludes zero.
takeaway
A coefficient confidence interval is estimate ± critical value × matching SE.
07 / 33 · 00:08:05
Activity 3(b): Lower STR from 22 to 20
chapter 5 guiding notes.pdf, PDF page 4, printed page 4.
Part B asks a new question: what is the ninety-five-percent interval for the change in district test scores when the student-to-teacher ratio falls from twenty-two to twenty? We need a two-unit change, not the interval for one additional student per teacher. The slope estimate is negative two point two eight. The ninety-five-percent slope interval is negative three point two two zero eight to negative one point three three nine two.
try it first
Name the quantity, choose the method and keep track of the units before opening the solution.
show worked solution
Old STR 22; new STR 20; ΔX=−2.
95% slope CI [−3.2208,−1.3392].
Slope estimate −2.28.
step by step
ΔX=20−22=−2.
Point estimate (−2.28)(−2)=4.56.
Multiply endpoints: 6.4416 and 2.6784.
Reorder CI=[2.6784,6.4416].
why it works
Start with new minus old. Twenty minus twenty-two is negative two. Multiply both endpoints of the slope interval by negative two. Negative three point two two zero eight becomes positive six point four four one six. Negative one point three three nine two becomes positive two point six seven eight four.
A negative multiplier reverses the order. Write the smaller number first: two point six seven eight four to six point four four one six, or about two point six eight to six point four four score points. The estimated mean change is positive four point five six points.
The positive signs mean an increase in the model's population mean prediction when the ratio decreases. This is not an interval for one particular district's future score. Calling it a causal effect would require additional justification beyond this regression.
final answer
95% CI [2.6784,6.4416] test-score points; model-implied mean increase. Point estimate +4.56.
takeaway
The mean change is β₁ΔX, so scale the slope interval by the fixed ΔX.
08 / 33 · 00:09:40
Activity 4(a): Define the binary-regressor model
chapter 5 guiding notes.pdf, PDF page 5, printed page 5.
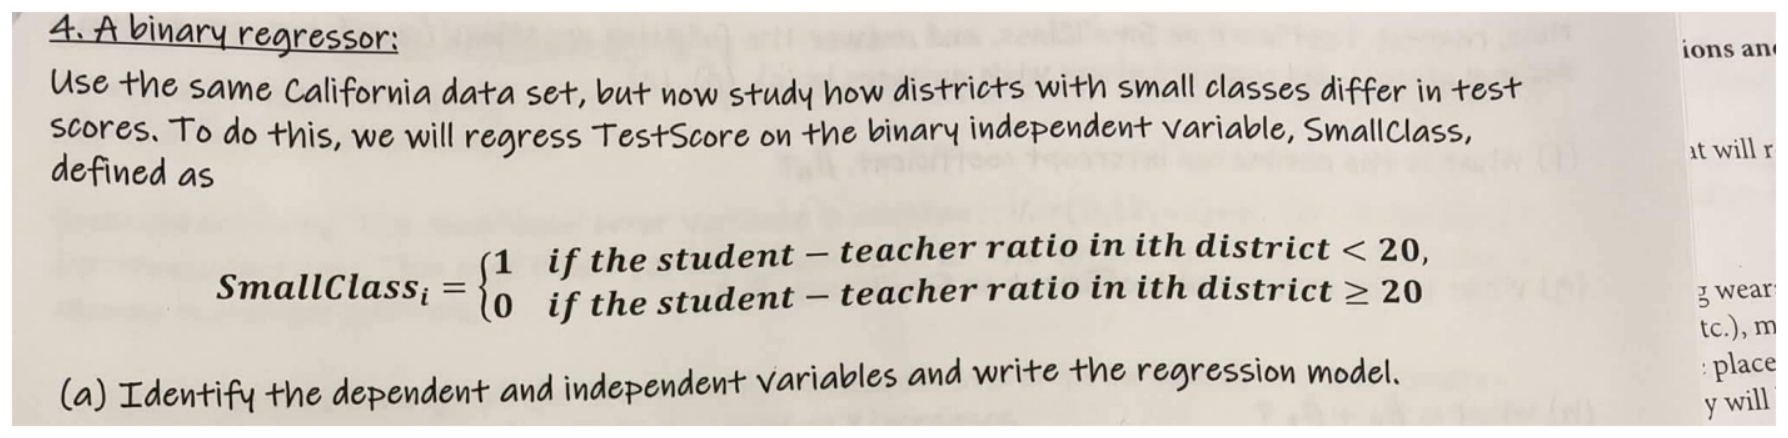
Activity Four changes the explanatory variable. We still study district test scores, but now Small Class equals one when the student-to-teacher ratio is below twenty and zero when it is twenty or higher. Part A asks us to identify the dependent and independent variables and write the regression model.
try it first
Name the quantity, choose the method and keep track of the units before opening the solution.
show worked solution
TestScore in points; SmallClass is 0/1.
STR<20 maps to 1; STR≥20 maps to 0.
step by step
Y=TestScore; X=SmallClass.
TestScore_i=β₀+β₁SmallClass_i+u_i.
SmallClass=1{STR<20}; exactly 20 belongs to 0.
Excel shown: =IF(A2<20,1,0).
why it works
The outcome, Y, is Test Score, in points. The regressor, X, is Small Class, a zero-or-one indicator. The population model is Test Score equals beta zero plus beta one times Small Class, plus the error. Those population coefficients do not have hats.
Notice the boundary carefully: a district with a ratio of exactly twenty belongs to the zero group. In Excel, the displayed instruction uses IF: if the ratio is less than twenty, enter one; otherwise enter zero.
We are now comparing two groups, not estimating a point change for every one-unit increase in the original ratio. Also, Small Class is just the worksheet's label; the underlying measure is a district staffing ratio, not a direct count of pupils in one classroom.
final answer
Dependent variable TestScore; independent variable SmallClass; population model TestScore_i=β₀+β₁SmallClass_i+u_i.
takeaway
A binary regressor encodes membership in two groups.
09 / 33 · 00:10:59
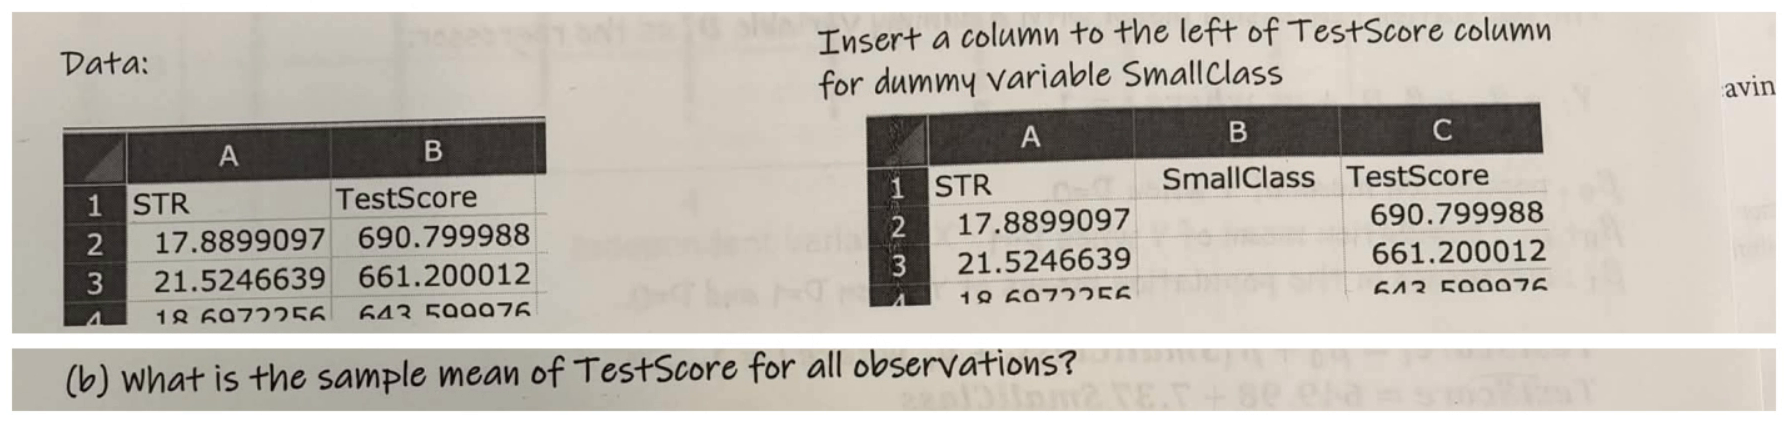
Activity 4(b): Overall test-score mean
chapter 5 guiding notes.pdf, PDF page 5, printed page 5.
Part B asks, what is the sample mean of Test Score for all observations? The rearranged sheet puts scores in column C, with four hundred twenty data rows running from row two through row four hundred twenty-one. The formula shown is AVERAGE of C two through C four hundred twenty-one.
try it first
Name the quantity, choose the method and keep track of the units before opening the solution.
show worked solution
420 observations; TestScore range C2:C421.
Verified cross-source mean: 654.1565 in Chapter 4 guiding notes p5.
step by step
Use all 420 TestScore rows: =AVERAGE(C2:C421).
Read verified cross-source Ybar=654.1565.
Round to 654.16 points.
why it works
The overall mean is six hundred fifty-four point one five six five, or six hundred fifty-four point one six points to two decimals. That number is displayed in your Chapter Four summary-statistics table, which is shown alongside this question. It is not printed as a completed answer on this Chapter Five page.
The word all matters. We have not filtered to small-ratio districts or large-ratio districts yet. Also, do not simply average the two group means unless the groups have equal numbers of observations. The overall mean gives every district equal weight, so larger groups contribute more observations.
final answer
Overall mean 654.1565, approximately 654.16 points.
takeaway
AVERAGE over all score rows answers the all-observations question.
10 / 33 · 00:12:07
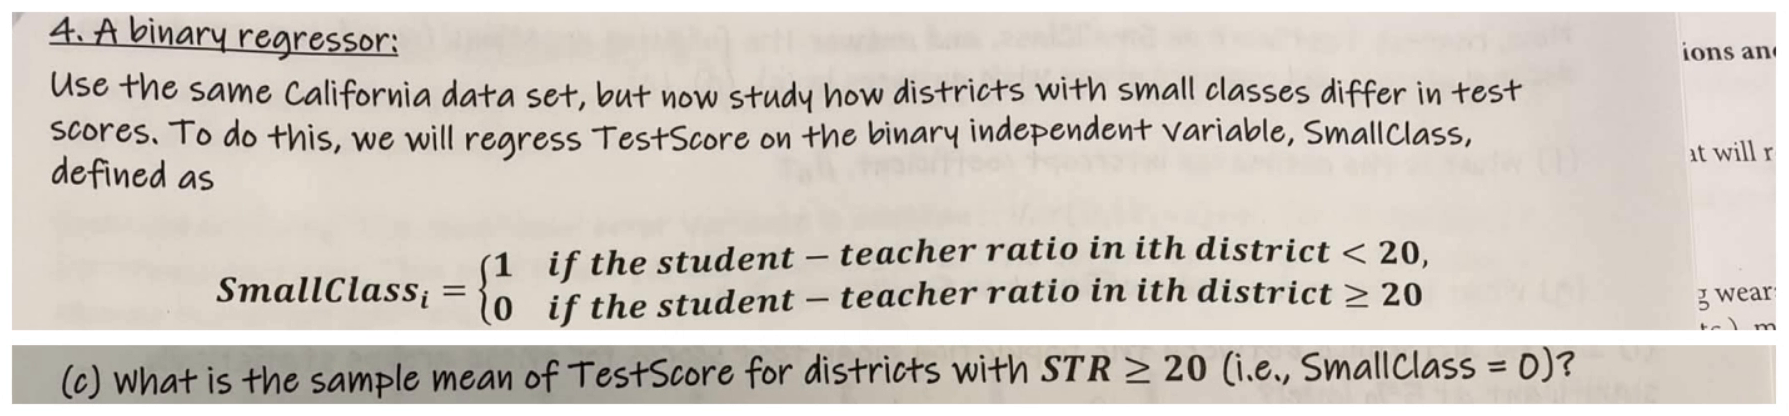
Activity 4(c): Mean for the zero group
chapter 5 guiding notes.pdf, PDF page 5, printed page 5.
Part C asks for the average score only among districts with ratios of twenty or higher. Those districts have Small Class equal to zero. The displayed AVERAGEIF formula checks column B for zero and averages the matching scores in column C. To solve it from the supplied pages, use the fitted equation printed on page six: Test Score hat equals six hundred forty-nine point nine eight plus seven point three seven times Small Class.
try it first
Name the quantity, choose the method and keep track of the units before opening the solution.
show worked solution
Group: STR≥20, SmallClass=0.
Fitted equation on p6: 649.98+7.37 SmallClass.
step by step
Filter SmallClass=0 with =AVERAGEIF(B2:B421,0,C2:C421).
Evaluate fitted equation at 0: 649.98+7.37(0)=649.98.
why it works
The result is six hundred forty-nine point nine eight points to two decimals. We can check it using the actual fitted equation printed on the next page: six hundred forty-nine point nine eight plus seven point three seven times Small Class.
Set Small Class to zero. The second term switches off, leaving six hundred forty-nine point nine eight. For an O L S regression with an intercept and just a binary regressor, that fitted value equals the zero group's sample mean.
This is not the average for every district, and it is not a population mean known with certainty. It is the observed sample average for the group selected by the condition in the question.
final answer
Mean TestScore for STR≥20 is 649.98 points, rounded.
takeaway
AVERAGEIF filters to group 0; an intercept-plus-dummy OLS regression fits that group mean at D=0.
11 / 33 · 00:13:29
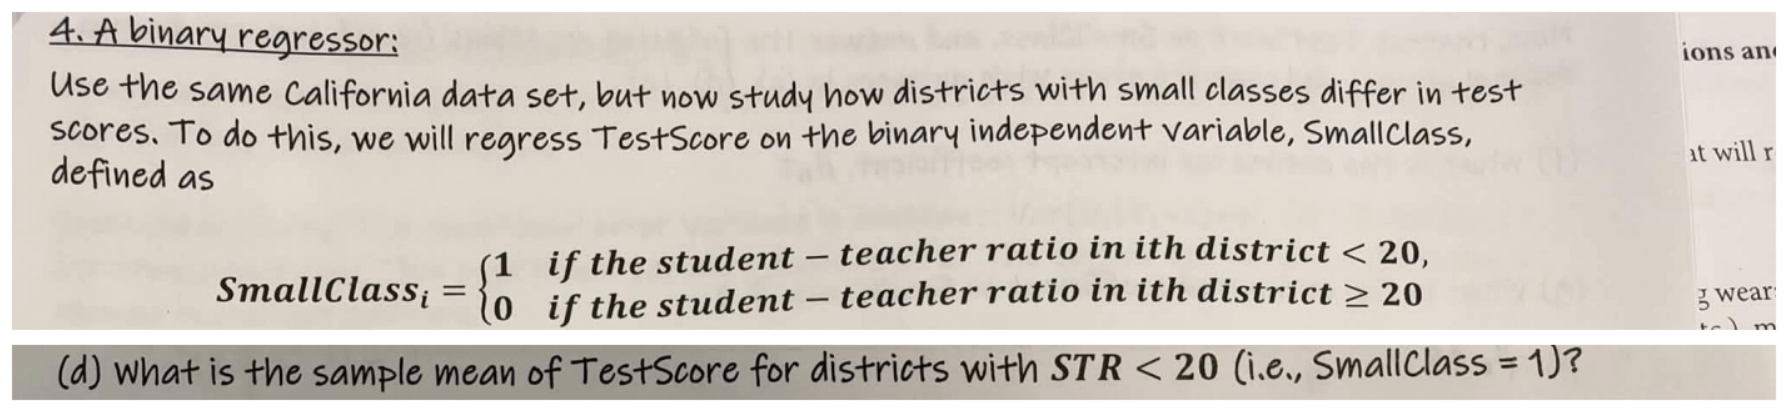
Activity 4(d): Mean for the one group
chapter 5 guiding notes.pdf, PDF page 5, printed page 5.
Part D asks the parallel question for districts whose ratio is below twenty. Their Small Class value is one. This time the AVERAGEIF formula checks for one rather than zero, while still averaging Test Score in column C. To solve it from the supplied pages, use the fitted equation printed on page six: Test Score hat equals six hundred forty-nine point nine eight plus seven point three seven times Small Class.
try it first
Name the quantity, choose the method and keep track of the units before opening the solution.
Use the fitted equation to check the result. Substitute one for Small Class: six hundred forty-nine point nine eight plus seven point three seven times one. That equals six hundred fifty-seven point three five points.
Why do we add the intercept and slope? The intercept starts us at the zero-group mean. Switching the indicator from zero to one adds the difference between the two groups. The sum is therefore the one-group mean.
Do not call seven point three seven the small-ratio group's entire average score. It is only the amount added to the baseline. The complete predicted level, and hence this group's sample mean in this binary regression, is six hundred fifty-seven point three five.
final answer
Mean TestScore for STR<20 is approximately 657.35 points.
takeaway
For a binary-only regression, the fitted value at 1 is intercept plus coefficient, equal to the group-1 sample mean.
12 / 33 · 00:14:50
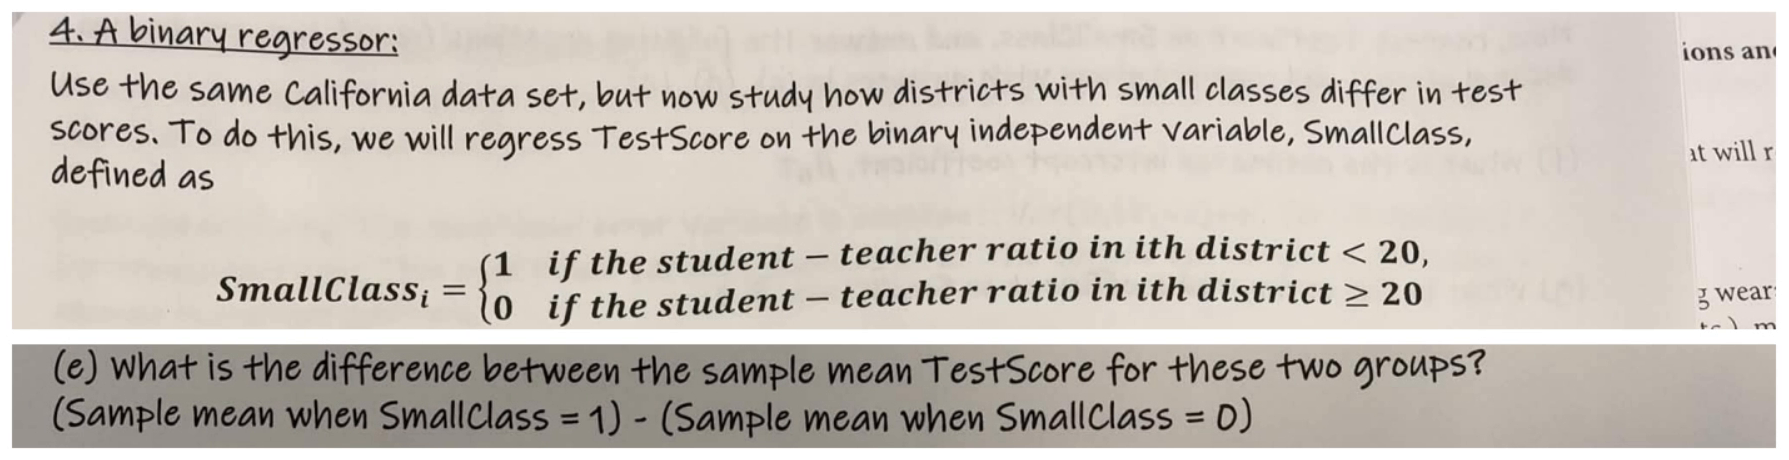
Activity 4(e): Subtract the group means
chapter 5 guiding notes.pdf, PDF page 5, printed page 5.
Part E now asks for the difference between the two sample averages. The PDF even states the subtraction order: mean when Small Class is one, minus mean when Small Class is zero. We found six hundred fifty-seven point three five for the one group and six hundred forty-nine point nine eight for the zero group.
try it first
Name the quantity, choose the method and keep track of the units before opening the solution.
show worked solution
Group-1 mean 657.35; group-0 mean 649.98.
Required order: 1 minus 0.
step by step
Difference=mean(D=1)−mean(D=0).
657.35−649.98=7.37 points.
why it works
Subtract in that order. Six hundred fifty-seven point three five minus six hundred forty-nine point nine eight equals seven point three seven points. The positive result tells us that the below-twenty group has the higher sample average.
This subtraction also explains the coefficient in the binary regression. The slope is a group difference, not the overall mean and not the average for either group by itself.
The conclusion applies to averages. It does not say that every district in the one group scores seven point three seven points above every district in the zero group, and it does not automatically identify a causal effect.
final answer
Group 1 has sample mean TestScore 7.37 points higher than group 0.
takeaway
The dummy coefficient is defined by the same group-1-minus-group-0 subtraction.
13 / 33 · 00:16:02
Activity 4(f): Read the fitted intercept
chapter 5 guiding notes.pdf, PDF page 6, printed page 6.
The next page asks us to regress Test Score on Small Class and compare the coefficients with the group averages we just calculated. Part F specifically asks, what is the estimated intercept, beta zero hat? The fitted equation printed on the page is six hundred forty-nine point nine eight plus seven point three seven times Small Class.
try it first
Name the quantity, choose the method and keep track of the units before opening the solution.
show worked solution
Fitted intercept 649.98.
SmallClass=0 means STR≥20.
step by step
Read constant term: β̂₀=649.98.
D=0 makes slope term vanish.
Matches part (c), mean for STR≥20.
why it works
The intercept is six hundred forty-nine point nine eight. It is the constant term, the number left when Small Class equals zero. That is why it matches part C: the sample average for districts with ratios of twenty or higher.
Notice the hat in the question. We are reading an estimated sample coefficient, not claiming to know the population intercept exactly. The population intercept would be beta zero without a hat. A fitted intercept in a binary model has a straightforward reference-group interpretation, unlike some numerical-regressor intercepts evaluated far outside the data range.
final answer
β̂₀=649.98 points; sample mean for SmallClass=0.
takeaway
The intercept is the fitted value when the regressor equals zero.
14 / 33 · 00:17:12
Activity 4(g): Read the binary coefficient
chapter 5 guiding notes.pdf, PDF page 6, printed page 6.
Part G asks, what is the estimated coefficient on Small Class, beta one hat? The fitted equation is Test Score hat equals six hundred forty-nine point nine eight plus seven point three seven times Small Class. Identify the coefficient and explain what it measures.
try it first
Name the quantity, choose the method and keep track of the units before opening the solution.
show worked solution
Coefficient multiplying SmallClass is 7.37.
Group 1 minus group 0 mean difference is 7.37.
step by step
Read β̂₁=7.37.
β̂₁=mean(D=1)−mean(D=0).
Connect to part (e).
why it works
The coefficient is positive seven point three seven. The interpretation follows from how a binary variable works. At zero, the fitted score is the intercept. At one, we add seven point three seven. So the coefficient is the one-group sample mean minus the zero-group sample mean. That matches the answer to part E exactly, apart from the worksheet's rounding.
Here one means a ratio below twenty, so the below-twenty group averages seven point three seven score points higher in this sample. The coefficient's units are score points for the switch from group zero to group one. It is not seven point three seven percent and not a slope per extra student in the original ratio. We changed the regressor, so its meaning changed too.
final answer
β̂₁=7.37 points, the group-1 minus group-0 sample mean difference.
takeaway
Moving a binary regressor from 0 to 1 adds its coefficient.
15 / 33 · 00:18:27
Activity 4(h): Add intercept and coefficient
chapter 5 guiding notes.pdf, PDF page 6, printed page 6.
Part H asks for beta zero hat plus beta one hat. Use the fitted intercept six hundred forty-nine point nine eight and the coefficient seven point three seven. Calculate their sum and explain which group it represents.
try it first
Name the quantity, choose the method and keep track of the units before opening the solution.
show worked solution
β̂₀=649.98; β̂₁=7.37.
step by step
β̂₀+β̂₁=649.98+7.37=657.35.
This is fitted value at SmallClass=1 and its sample group mean.
why it works
Their sum is six hundred fifty-seven point three five. Why ask for the sum instead of just another coefficient? Because it gives the fitted value when Small Class equals one. In a regression with an intercept and this single binary regressor, that fitted value equals the one group's sample mean. It therefore matches part D, the mean for districts with ratios below twenty.
Keep the three meanings separate on the screen: the intercept is the zero-group average; the slope is the difference between group averages; the intercept plus slope is the one-group average. Once those three labels are clear, a binary-regression equation is just a compact way of storing two group means.
final answer
657.35 points; mean for SmallClass=1, agreeing with part (d).
takeaway
At D=1 the fitted equation is β̂₀+β̂₁.
16 / 33 · 00:19:34
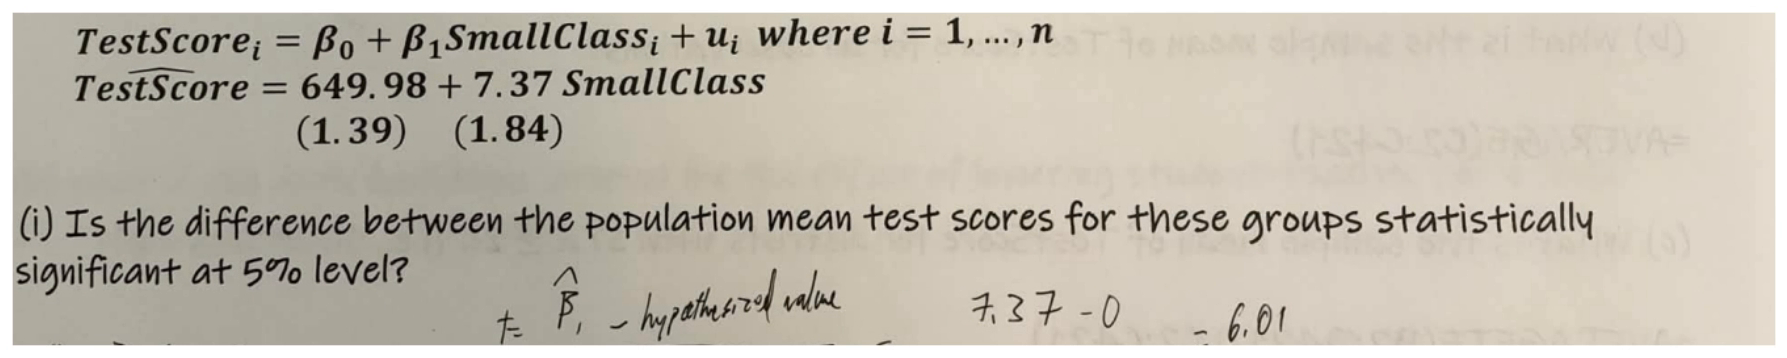
Activity 4(i): Is the group difference significant?
chapter 5 guiding notes.pdf, PDF page 6, printed page 6.
Part I asks whether the difference between population mean test scores is statistically significant at five percent. The fitted difference is seven point three seven points, with standard error one point eight four. The one point three nine beneath the intercept is not the standard error we need.
try it first
Name the quantity, choose the method and keep track of the units before opening the solution.
show worked solution
Difference estimate 7.37; matching SE 1.84.
Two-sided zero-difference test at 5%.
Source handwriting reports 6.01 incorrectly.
step by step
H₀: β₁=0, equivalently μ₁−μ₀=0; H₁: β₁≠0.
t=7.37/1.84=4.00543478≈4.01, NOT 6.01.
p≈0.0000619035.
Reject at 5%; positive population group-mean difference supported.
why it works
The null is that the population group means are equal. Because the binary slope already represents their difference, write beta one equals zero. The two-sided alternative is beta one not equal to zero. Do not subtract the regression intercept from the slope; that would test the wrong quantity.
Compute seven point three seven minus zero, divided by one point eight four. The result is about four point zero one. The handwritten answer visible on the source says six point zero one, but that division is an arithmetic error. The corrected result still rejects the null.
The two-sided normal p-value is about zero point zero zero zero zero six two, well below point zero five. There is evidence of a population group-mean difference, estimated positive for below-twenty districts. Statistical significance does not turn this group comparison into proof of causation.
final answer
t≈4.01; p≈0.0000619; reject zero difference at 5%.
takeaway
The dummy slope already equals the group-mean difference, so test β₁=0.
17 / 33 · 00:21:01
Read the warning about standard-error methods
chapter 5 additional material.pdf, PDF page 1, printed page 8.
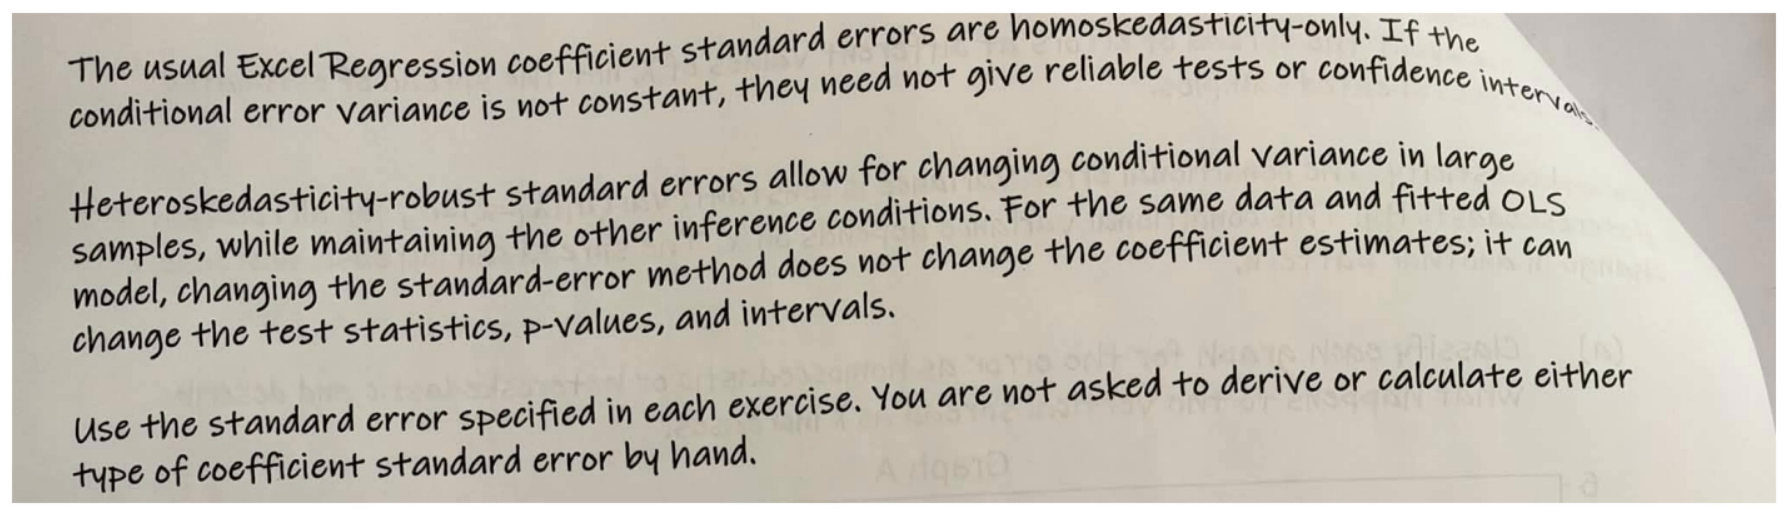
Printed Chapter Five page seven was not supplied. We will use the supplied page eight and will not invent the missing page. Now look at printed page eight in the additional material. Its opening paragraphs explain why the standard-error method matters. Homoskedasticity means the error spread stays equally wide as X changes. Heteroskedasticity means that spread can change, like a narrow band turning into a wide fan.
try it first
Name the quantity, choose the method and keep track of the units before opening the solution.
show worked solution
Ordinary Excel SE assumes constant conditional error variance.
Robust SE permits changing variance under its conditions.
Same data and OLS specification imply same coefficients across SE methods.
Same fitted OLS coefficients; possibly different SEs and inference.
Use stated valid SE method; do not choose for significance.
Assignment preparation does not make the marked homework-only comparison an exam requirement.
why it works
The usual Excel coefficient standard errors assume constant conditional error variance. If that condition fails, those errors may give unreliable tests and confidence intervals. Robust standard errors allow the variance to change in large samples, while the other inference conditions still need to hold.
For the same data and fitted O L S model, switching standard-error methods does not change the estimated coefficients. It changes our uncertainty measurement, which can change test statistics, p-values, and intervals. The page tells us to use the specified standard error, not derive either formula by hand.
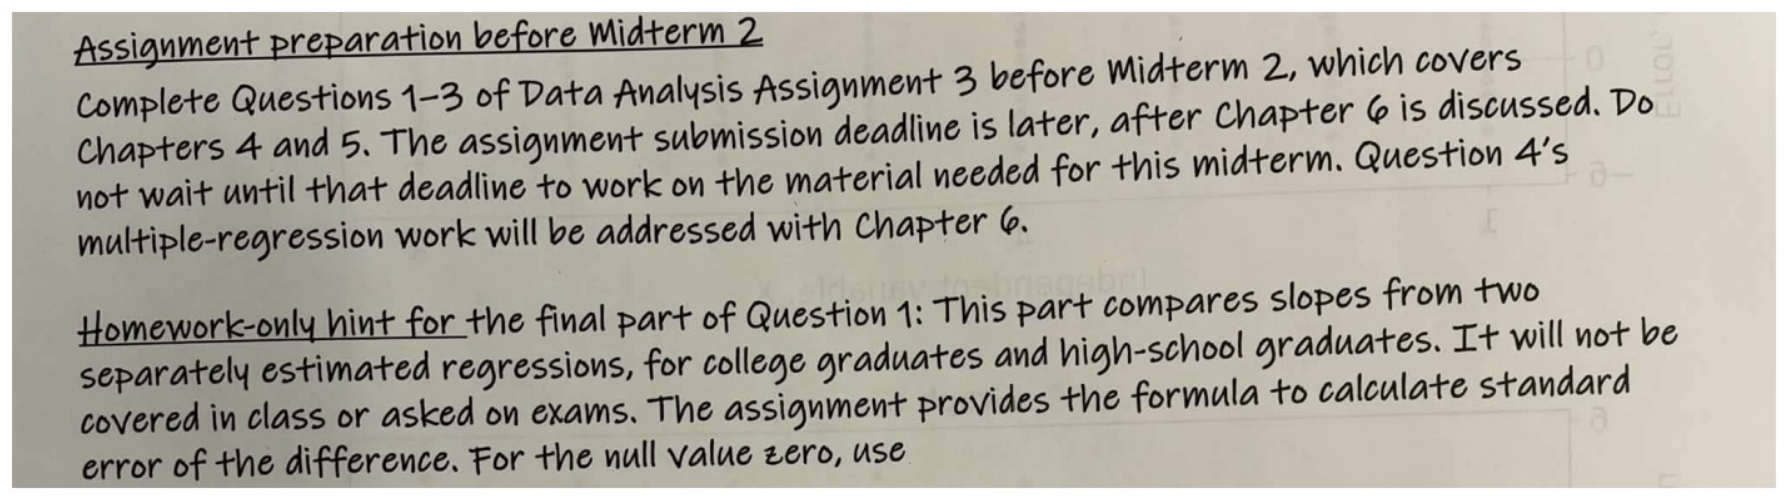
The preparation note also matters: work through Assignment Three, Questions One to Three, before Midterm Two. Question Four belongs with Chapter Six. The separate-regression slope comparison at the end of Question One is explicitly homework-only, not an exam topic. Keep that exception separate from the practice questions we are about to solve.
final answer
Ordinary and robust SEs measure uncertainty under different variance assumptions; changing SE method does not refit the coefficient. Follow the printed preparation exceptions.
takeaway
Inference depends on the validity of the uncertainty estimate, not just the fitted coefficient.
18 / 33 · 00:22:35
P1: Choose hypotheses for “exceeds 1.5”
chapter 5 additional material.pdf, PDF page 1, printed page 8.
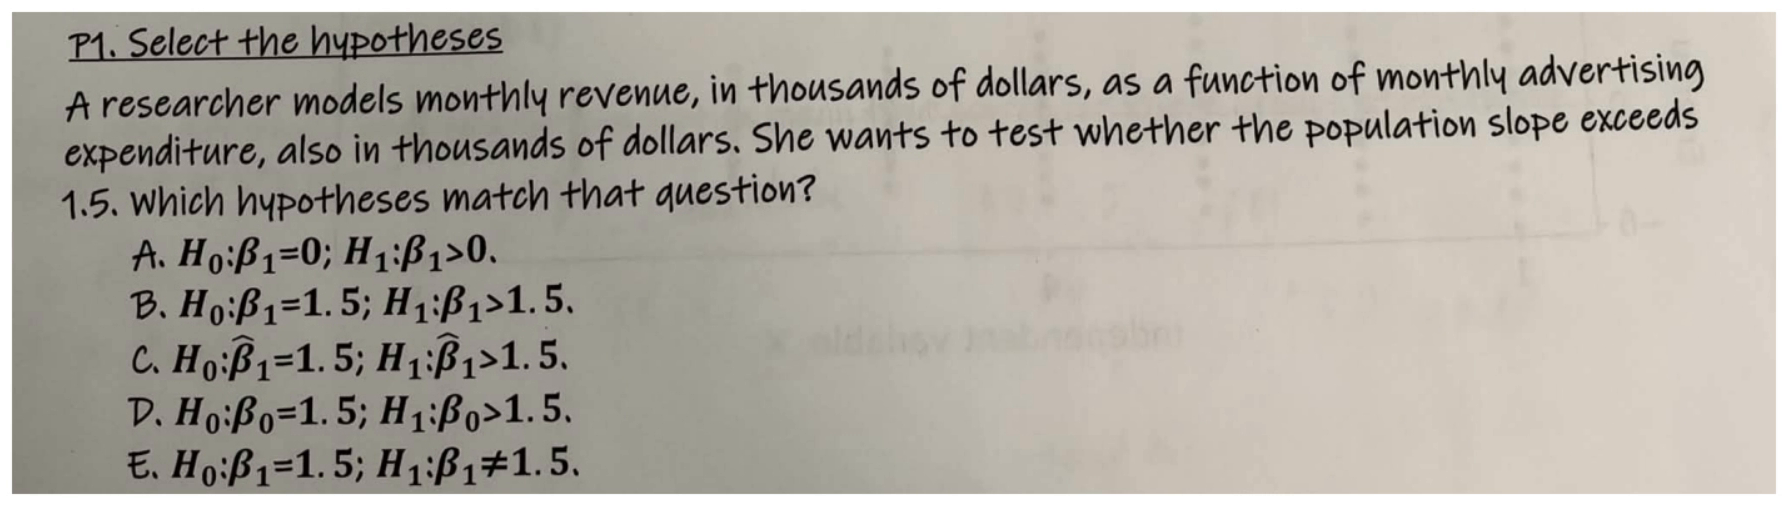
Practice One describes monthly revenue predicted from monthly advertising expenditure, with both measured in thousands of dollars. The researcher wants to know whether the population slope exceeds one point five. Which pair of hypotheses matches that question?
try it first
Name the quantity, choose the method and keep track of the units before opening the solution.
Identify three things before looking for an answer. We are testing the slope, so use beta one, not beta zero. We are testing a population claim, so do not put a hat on beta one. Finally, exceeds means greater than, so the alternative points to the right of one point five.
The worksheet's correct choice is B: the null slope equals one point five, and the alternative slope is greater than one point five. The null value is not zero just because zero is common in other questions.
Choice C incorrectly tests the observed estimate rather than the population parameter. Choice D tests the intercept. Choice E looks for departures in either direction, but this researcher specifically asks whether the slope exceeds the threshold. No test statistic is needed to select these hypotheses.
final answer
B: H₀: β₁=1.5; H₁: β₁>1.5.
takeaway
Identify coefficient, reference value, and direction before any calculation.
19 / 33 · 00:23:52
P2: Test an intercept in thousand-dollar units
chapter 5 additional material.pdf, PDF page 2, printed page 9.
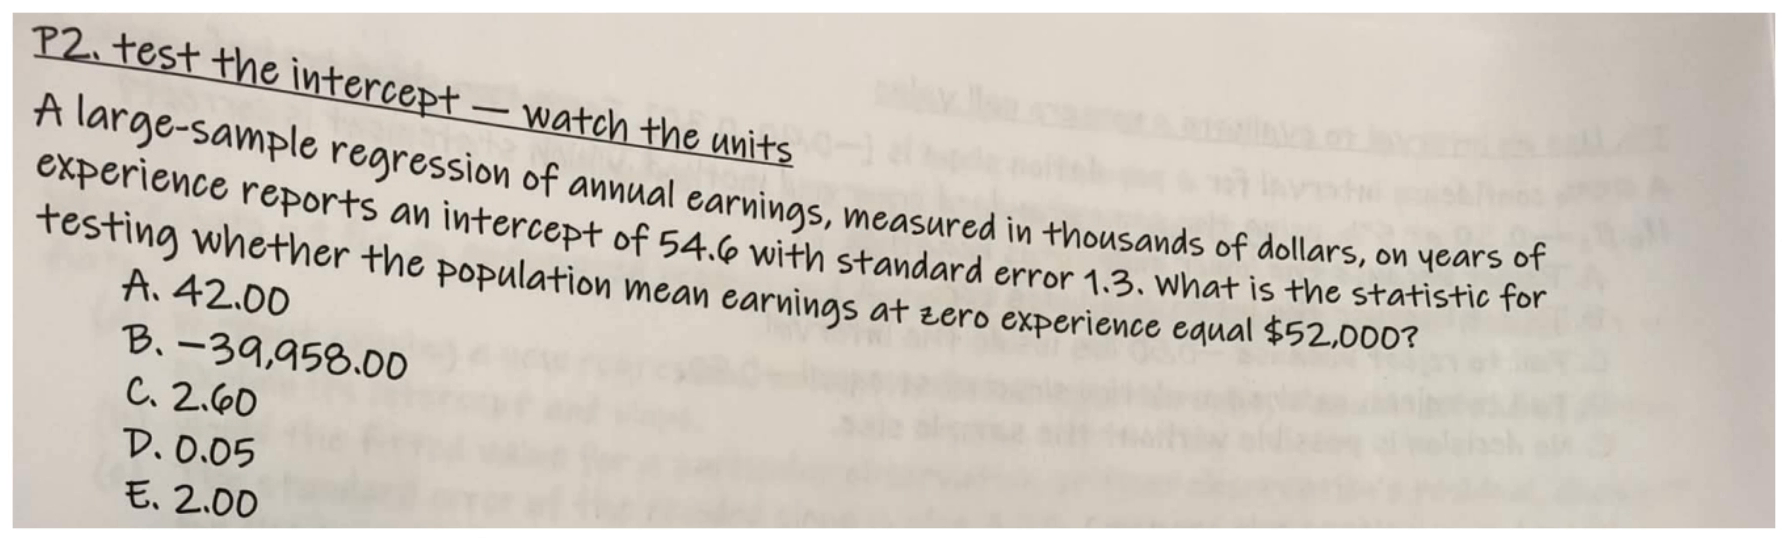
Practice Two gives a regression of annual earnings on years of experience. Earnings are measured in thousands of dollars. The estimated intercept is fifty-four point six, its standard error is one point three, and the question tests whether population mean earnings at zero experience equal fifty-two thousand dollars. What is the test statistic?
try it first
Name the quantity, choose the method and keep track of the units before opening the solution.
show worked solution
Intercept estimate 54.6 thousand dollars.
Intercept SE 1.3 thousand dollars.
Null value $52,000 = 52 thousand dollars.
step by step
Convert $52,000 to 52 in model units.
t=(54.6−52)/1.3=2.6/1.3=2.00.
Select E.
why it works
Zero experience tells us to test the intercept. The units tell us to enter the null as fifty-two, not fifty-two thousand. Now use estimate minus claim over standard error: fifty-four point six minus fifty-two equals two point six; divide by one point three to get two point zero zero. Choice E is correct.
The numerator is a difference in thousand-dollar units, and the denominator uses the same units, so the statistic has no dollar units. Dividing fifty-four point six by one point three would test a zero intercept instead. Subtracting fifty-two thousand from fifty-four point six would mix dollars and thousands of dollars. Both mistakes answer a different, incorrectly scaled question.
final answer
E: t=2.00; no decision is requested by this question.
takeaway
At zero experience the intercept represents the model’s mean; all numerator terms must share units.
20 / 33 · 00:25:11
P3: A right-tailed test with a negative estimate
chapter 5 additional material.pdf, PDF page 2, printed page 9.
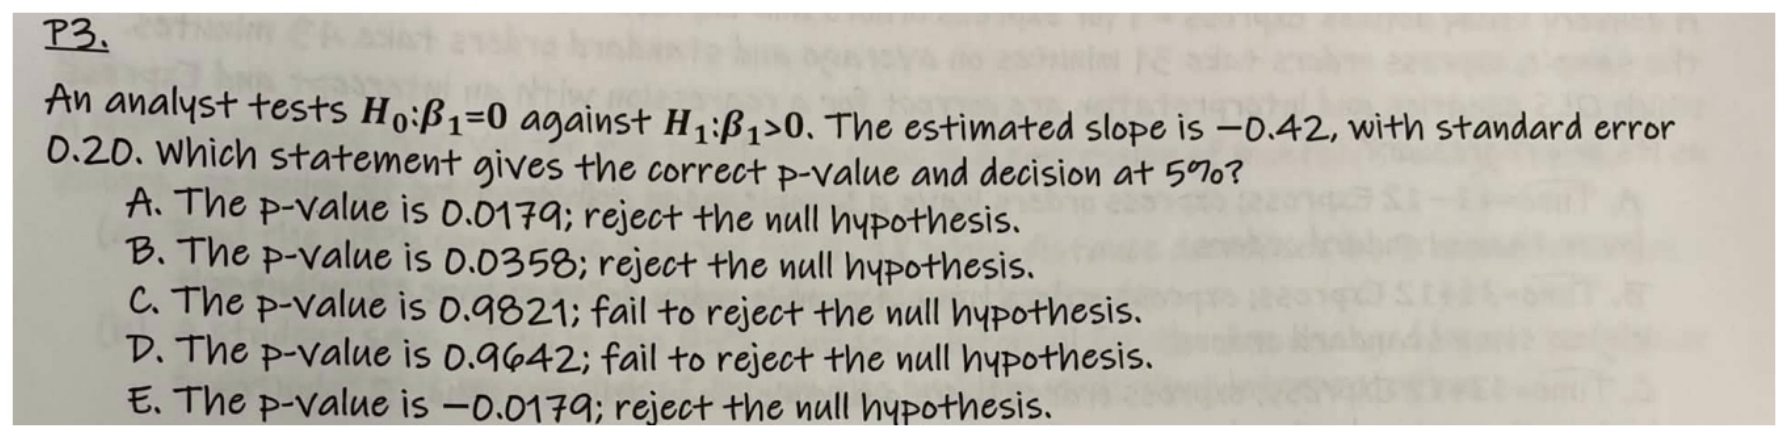
Practice Three already gives the hypotheses: the null slope equals zero and the alternative slope is greater than zero. The estimated slope is negative zero point four two, with standard error zero point two zero. Which p-value and five-percent decision are correct?
try it first
Name the quantity, choose the method and keep track of the units before opening the solution.
show worked solution
β̂₁=−0.42; SE=0.20; null 0.
Right-tailed alternative β₁>0; α=0.05.
step by step
t=(−0.42−0)/0.20=−2.10.
Right-tail p=P(Z>−2.10)=0.9821356≈0.9821.
p>0.05; fail to reject.
Select C.
why it works
Calculate the statistic first. Negative zero point four two divided by zero point two zero equals negative two point one zero. Now stop and look at the alternative again: greater than means the right tail. We need the normal area to the right of negative two point one zero, not the small area to its left.
That right-tail area is about zero point nine eight two one. It is much larger than point zero five, so fail to reject. Choice C is correct.
The estimate lies strongly in the opposite direction from the positive alternative. A small left-tail probability is not evidence for the positive claim. Do not take an absolute value automatically in a one-sided test, and remember that a p-value can never be negative.
final answer
C: p≈0.9821; fail to reject H₀ at 5%.
takeaway
A one-sided p-value follows the alternative’s direction, not the estimate’s sign.
21 / 33 · 00:26:27
P4: A 99% intercept interval and a 1% test
chapter 5 additional material.pdf, PDF page 2, printed page 9.
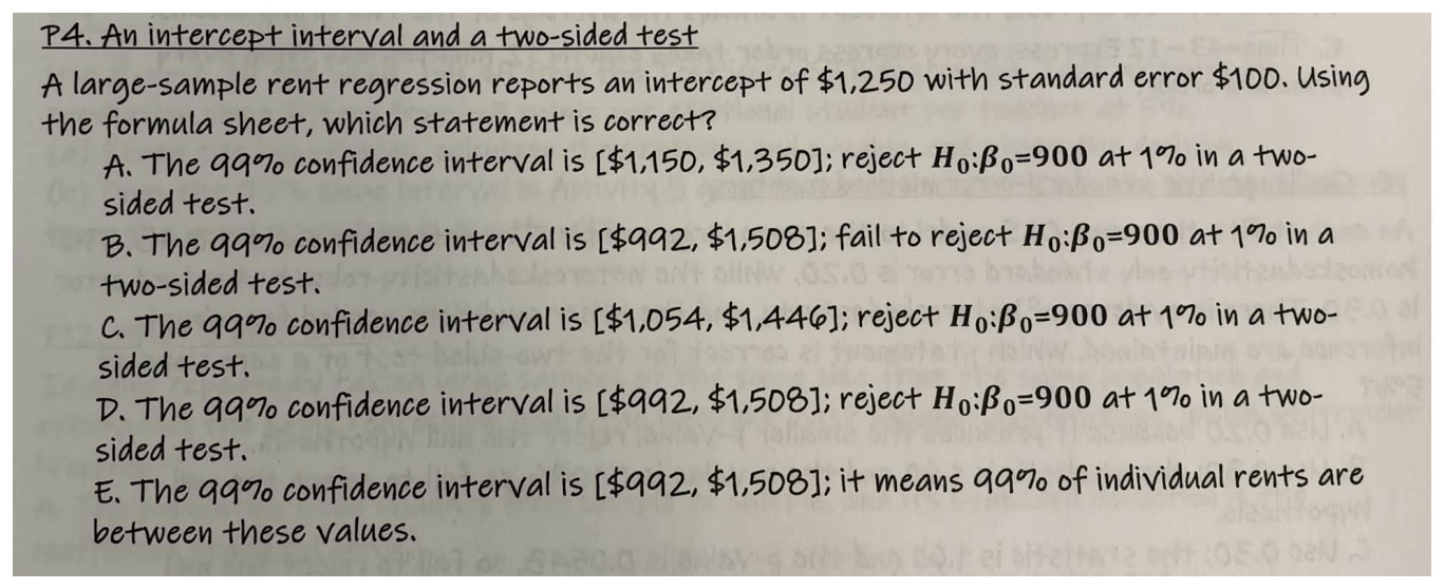
Practice Four gives a rent-regression intercept of twelve hundred fifty dollars with a standard error of one hundred dollars. It asks us to choose the correct ninety-nine-percent confidence interval and decision for a two-sided one-percent test of a nine-hundred-dollar population intercept.
try it first
Name the quantity, choose the method and keep track of the units before opening the solution.
show worked solution
Intercept $1,250; SE $100.
99% critical value 2.58.
Null intercept $900; matching two-sided α=0.01.
step by step
Margin=2.58×100=$258.
99% CI=[1250−258,1250+258]=[$992,$1508].
900 outside interval → reject at 1% two-sided.
Select D.
why it works
For ninety-nine percent, the worksheet's critical value is two point five eight. Multiply by the standard error: two point five eight times one hundred gives a margin of two hundred fifty-eight dollars. Subtract and add that margin to twelve hundred fifty. The interval runs from nine hundred ninety-two to one thousand five hundred eight dollars.
Now compare the specific null value, nine hundred, with this interval. Nine hundred is below its lower endpoint, so it is outside. Reject the null in the matching one-percent two-sided test. Choice D has both pieces correct.
Choice B has the right interval but the wrong decision. Choice E confuses a coefficient interval with a range of individual rents. This interval concerns the population intercept, meaning the model's mean at zero regressor value, not ninety-nine percent of people's actual rent payments.
final answer
D: 99% CI [$992,$1,508]; reject H₀: β₀=900 at 1% two-sided.
takeaway
The matching (1−α) confidence interval rejects a two-sided null outside the interval.
22 / 33 · 00:27:52
P5: Use the 98% critical value
chapter 5 additional material.pdf, PDF page 2, printed page 9.
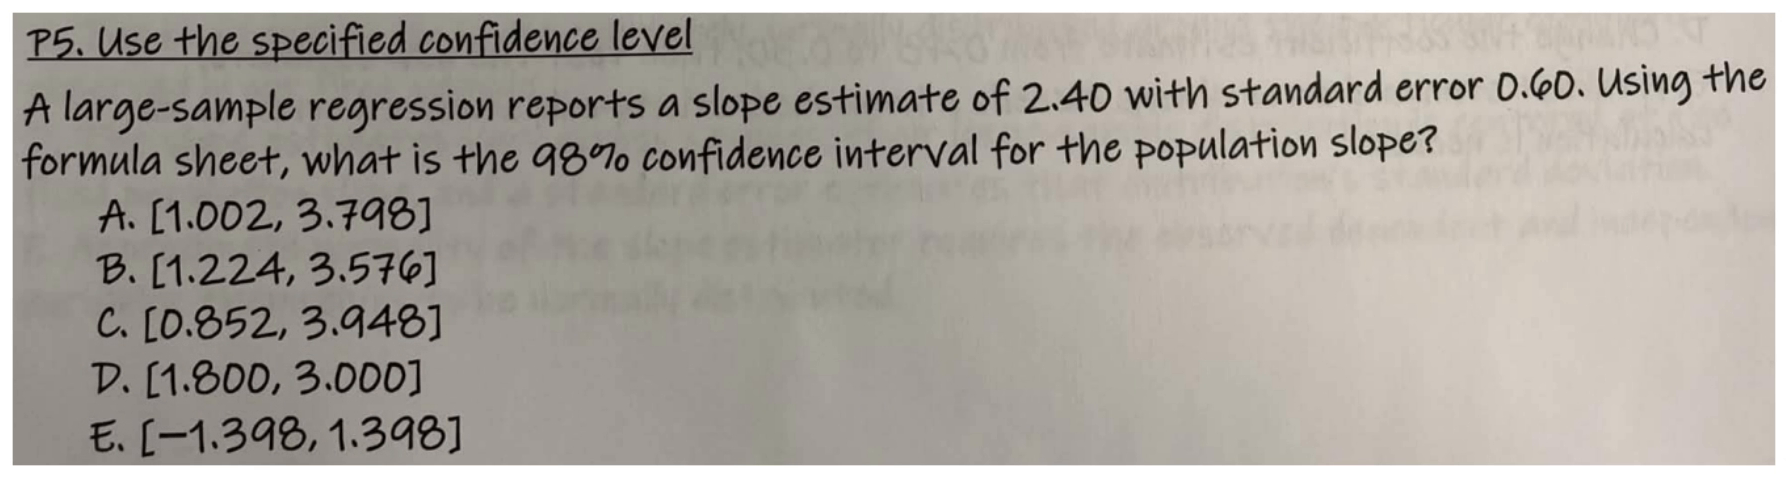
Practice Five asks for a ninety-eight-percent confidence interval for a population slope. The estimated slope is two point four zero and its standard error is zero point six zero. The critical word is ninety-eight: do not use the ninety-five-percent multiplier just because you remember it best.
try it first
Name the quantity, choose the method and keep track of the units before opening the solution.
show worked solution
β̂₁=2.40; SE=0.60; confidence level 98%.
Course critical value 2.33.
step by step
98% → critical value 2.33.
Margin=2.33×0.60=1.398.
CI=[2.40−1.398,2.40+1.398]=[1.002,3.798].
Select A.
why it works
The worksheet lists two point three three for ninety-eight percent. Multiply two point three three by zero point six zero to get the margin, one point three nine eight. Then subtract that margin from two point four zero and add it to two point four zero.
The lower endpoint is one point zero zero two, and the upper endpoint is three point seven nine eight. That is choice A.
The interval must be centered on the sample estimate, two point four, not on zero. Using one point nine six would produce the ninety-five-percent interval in a distractor, while two point five eight would produce a ninety-nine-percent interval. The method stays the same; the requested confidence level changes the multiplier.
final answer
A: [1.002,3.798].
takeaway
The confidence level determines the multiplier; the estimate determines the center.
23 / 33 · 00:29:06
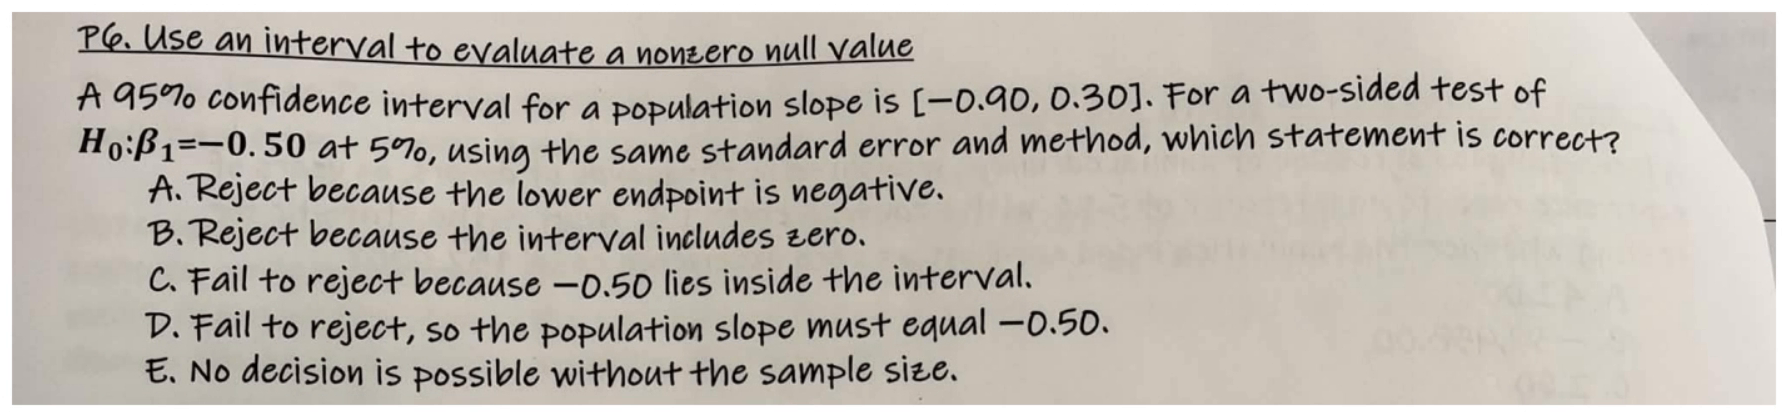
P6: Test the actual nonzero null value
chapter 5 additional material.pdf, PDF page 3, printed page 10.
Practice Six provides a ninety-five-percent slope interval from negative zero point nine zero to positive zero point three zero. The null being tested is negative zero point five zero, with a two-sided five-percent test using the same method and standard error. Which statement is correct?
try it first
Name the quantity, choose the method and keep track of the units before opening the solution.
show worked solution
95% CI [−0.90,0.30].
Null −0.50; two-sided 5%; same method and SE.
step by step
Check −0.90≤−0.50≤0.30.
Null value lies inside matching 95% CI.
Fail to reject at 5%; do not conclude exact equality.
Select C.
why it works
Put negative zero point five on a number line between the interval endpoints. It lies inside. Therefore, fail to reject that null at five percent. Choice C is correct.
Notice that the question is not asking whether the interval includes zero. Zero happens to be inside too, but the proposed value we must evaluate is negative zero point five. The lower endpoint being negative is not itself a reason to reject anything.
We also do not need the sample size separately, because the supplied interval already gives the matching test decision. Finally, failure to reject is not proof that the slope equals negative zero point five. It means this sample does not rule out that value at the stated significance level.
final answer
C: fail to reject because −0.50 lies inside the interval.
takeaway
For a matched test, check inclusion of the proposed value, not inclusion of zero by habit.
24 / 33 · 00:30:23
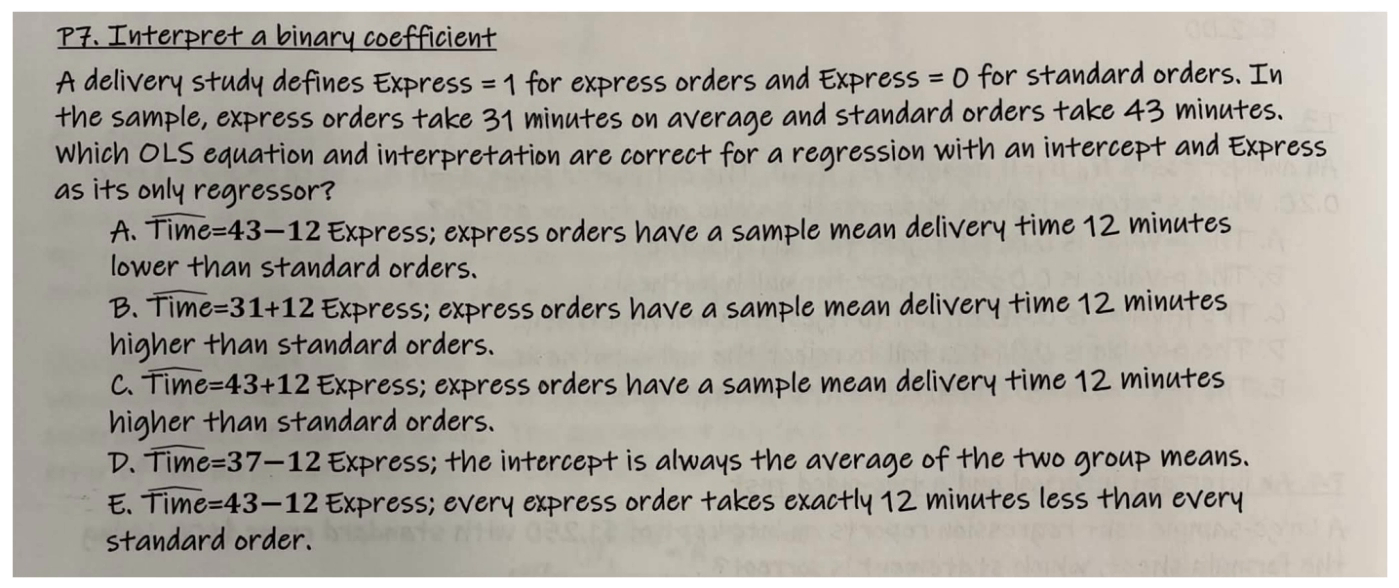
P7: Build a delivery-time dummy regression
chapter 5 additional material.pdf, PDF page 3, printed page 10.
Practice Seven defines Express as one for express delivery and zero for standard delivery. The sample mean is thirty-one minutes for express orders and forty-three minutes for standard orders. It asks for the correct O L S equation and interpretation when Express is the only regressor and the model has an intercept.
try it first
Name the quantity, choose the method and keep track of the units before opening the solution.
Start with the zero group. Standard orders have Express equal to zero, so the intercept is their mean: forty-three. Then calculate the slope as one-group mean minus zero-group mean: thirty-one minus forty-three equals negative twelve.
The fitted equation is Time hat equals forty-three minus twelve times Express. Check both groups. Zero gives forty-three; one gives thirty-one. Choice A is correct: express orders have a sample average delivery time twelve minutes lower.
Choice E uses the same equation but makes a stronger, incorrect claim about every individual order. The regression reproduces group means, not a fixed twelve-minute gap between every possible pair. The intercept is also not automatically the unweighted average of the two group means.
final answer
A: Time_hat=43−12Express; express sample mean delivery time is 12 minutes lower.
takeaway
Intercept is group-0 mean; slope is group-1 mean minus group-0 mean.
25 / 33 · 00:31:45
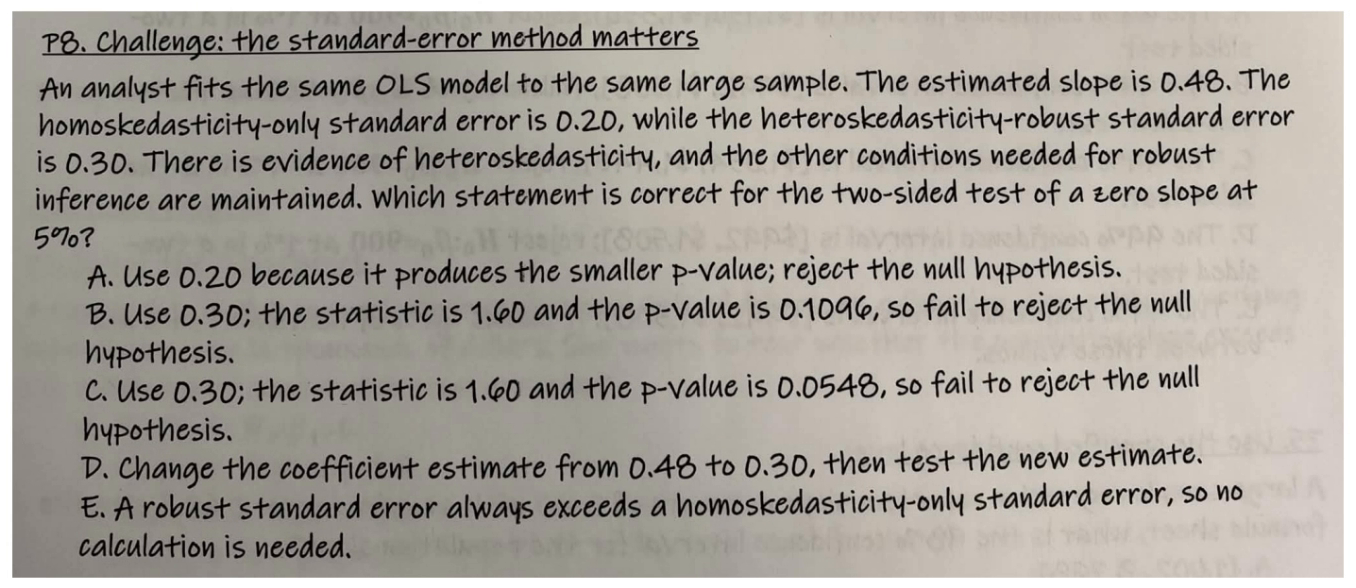
P8: Use the valid robust standard error
chapter 5 additional material.pdf, PDF page 3, printed page 10.
Practice Eight keeps the same O L S model and the same large sample. The slope is zero point four eight. The ordinary standard error is zero point two zero, while the robust one is zero point three zero. The question explicitly gives evidence of heteroskedasticity and says the other robust-inference conditions hold. We need a two-sided zero-slope test at five percent.
try it first
Name the quantity, choose the method and keep track of the units before opening the solution.
show worked solution
Slope 0.48; ordinary SE0.20; robust SE0.30.
Heteroskedasticity present; other robust conditions hold.
Two-sided test H₀: β₁=0, α=0.05.
step by step
Use robust SE=0.30 under given variance conditions.
t=0.48/0.30=1.60.
p=2P(Z>1.60)=0.1095986≈0.1096.
Fail to reject at 5%.
Select B.
why it works
Use the robust standard error, zero point three zero. The statistic is zero point four eight minus zero, divided by zero point three zero, which equals one point six zero. The one-tail normal area above one point six is about zero point zero five four eight. Since the test is two-sided, double it to get zero point one zero nine six.
That exceeds point zero five, so fail to reject. Choice B is correct. Choice C forgot the second tail.
Do not choose the ordinary error simply to obtain significance. Do not replace the slope with the standard error. Robust standard errors change uncertainty measurement, not the fitted coefficient, and they are not guaranteed to be larger in every dataset.
final answer
B: robust SE0.30, t=1.60, two-sided p≈0.1096; fail to reject.
takeaway
Validity of inference determines the SE method; two-sided alternatives require both tails.
26 / 33 · 00:33:09
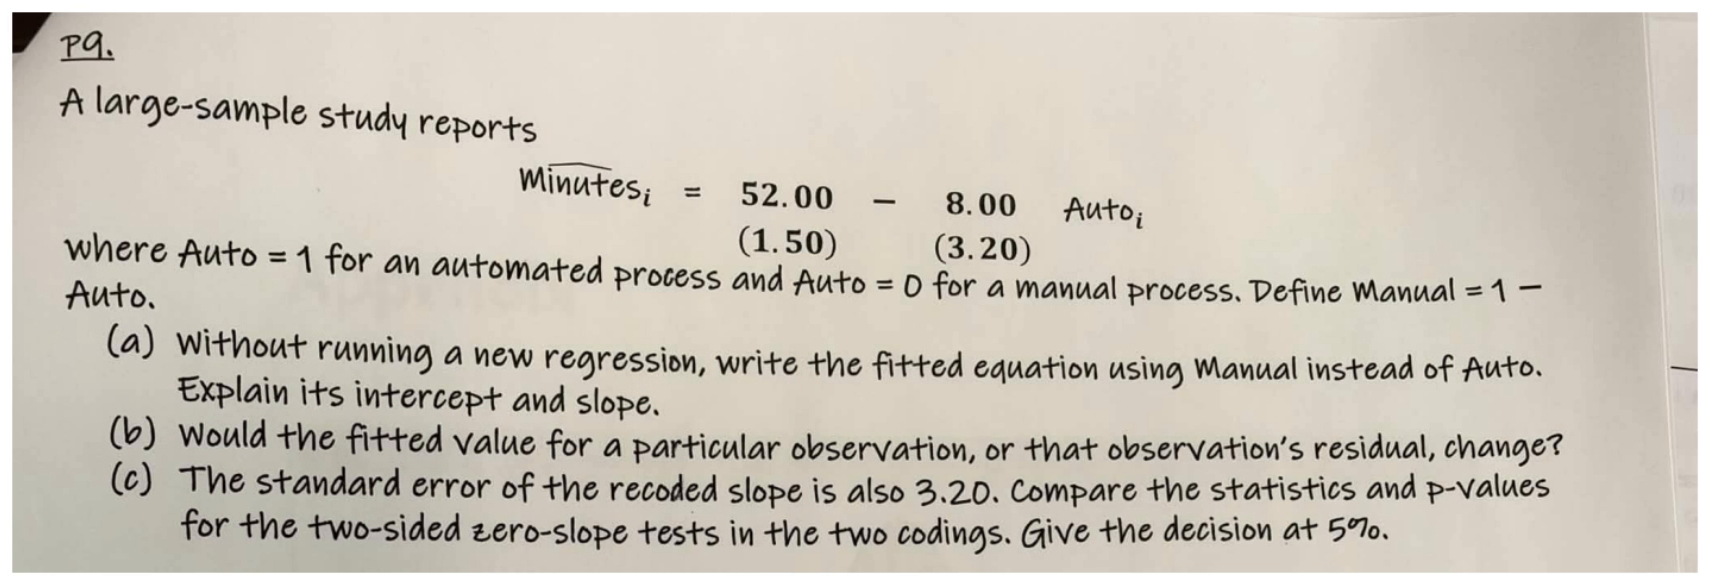
P9(a): Reverse the binary coding
chapter 5 additional material.pdf, PDF page 4, printed page 11.
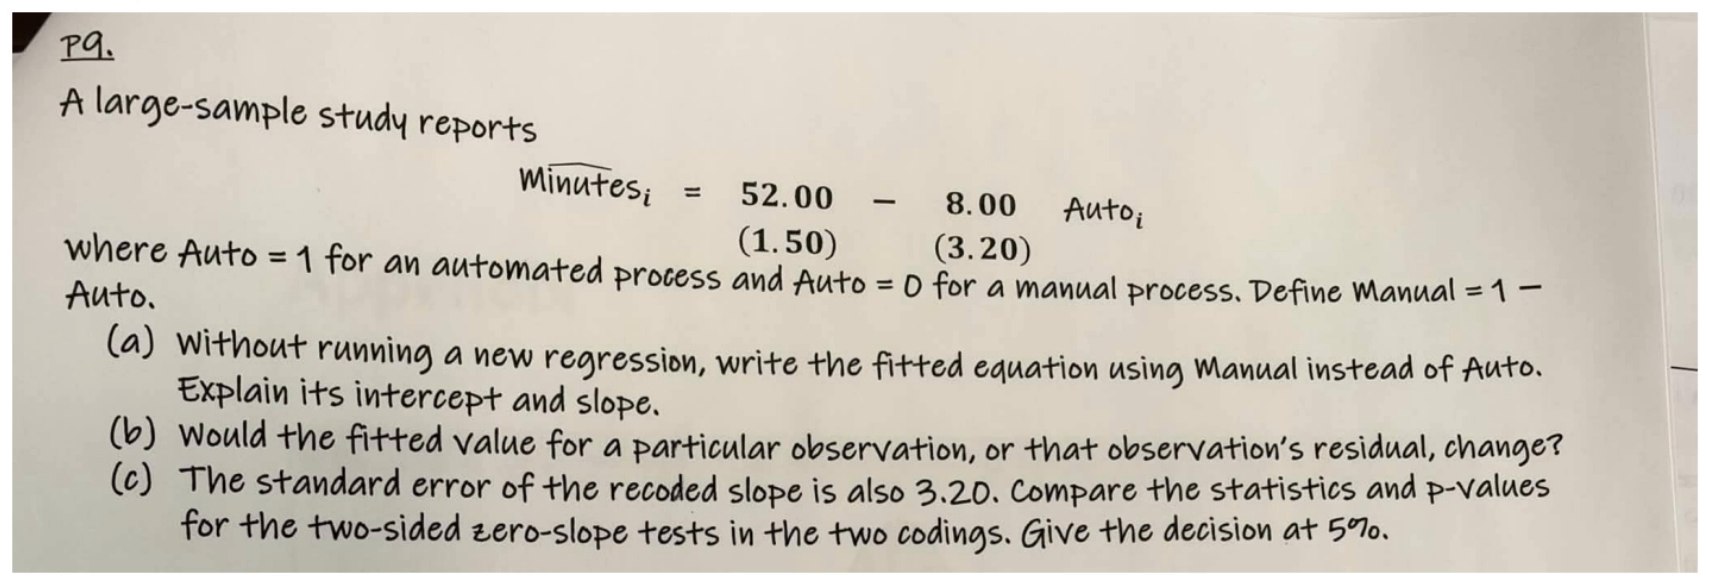
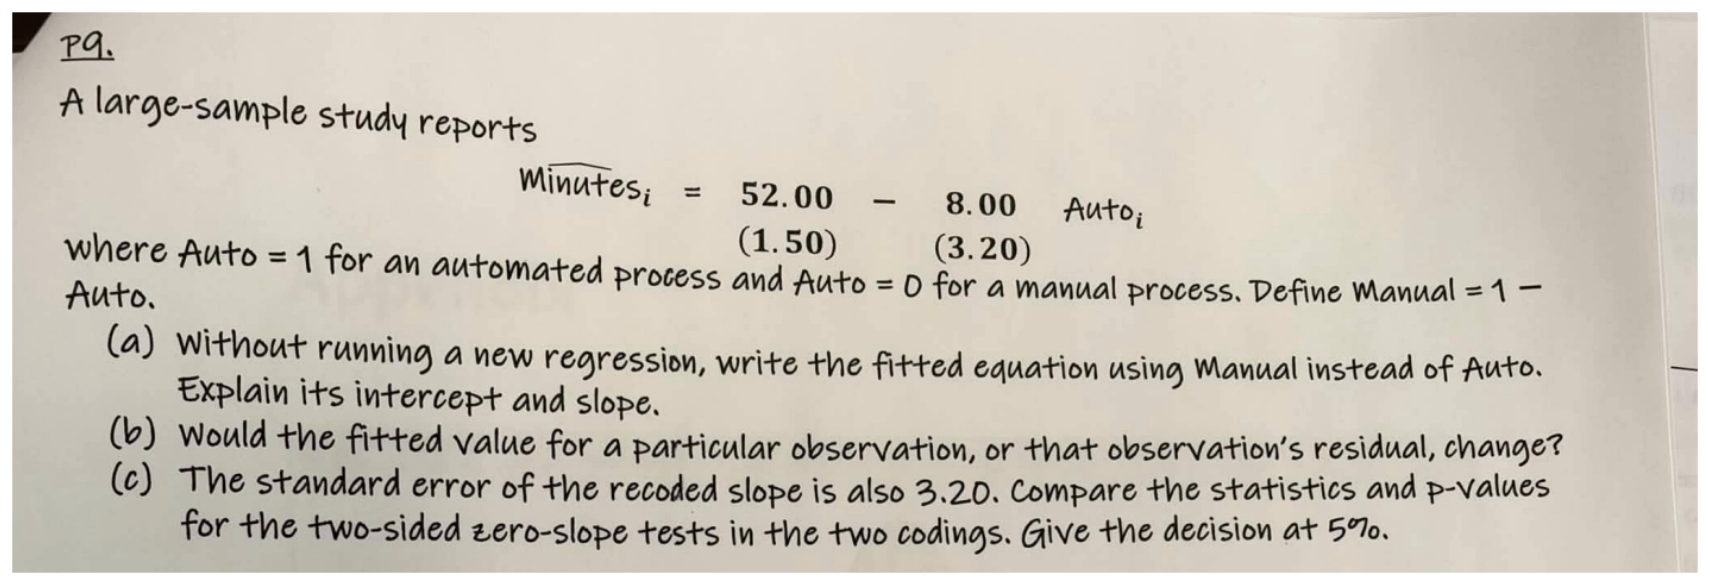
Practice Nine gives the fitted equation Minutes hat equals fifty-two minus eight times Auto. Auto is one for an automated process and zero for a manual process. We now define Manual as one minus Auto. Part A asks us to rewrite the fitted equation without running another regression and explain the new intercept and slope.
try it first
Name the quantity, choose the method and keep track of the units before opening the solution.
show worked solution
Original fitted equation 52−8Auto.
Auto=1 automated; Auto=0 manual.
Manual=1−Auto, so Auto=1−Manual.
step by step
Auto=1−Manual.
52−8(1−Manual)=44+8Manual.
New intercept44: automated mean, Manual=0.
New slope+8: manual minus automated mean.
why it works
Since Manual equals one minus Auto, Auto also equals one minus Manual. Substitute that into the original equation: fifty-two minus eight times the quantity one minus Manual. Distribute the negative eight. We get fifty-two minus eight plus eight times Manual, which simplifies to forty-four plus eight times Manual.
The new zero group is automated processes, so the new intercept, forty-four minutes, is their sample mean. The new slope, positive eight minutes, is manual minus automated mean time. Manual processes average eight minutes longer.
Check both codings: automated is forty-four, manual is fifty-two. We changed the labels and the equation's appearance, not the actual group predictions. Do not assume the new intercept has the old intercept's standard error; that was not provided.
final answer
Minutes_hat=44+8Manual. Intercept44 minutes for automated; slope+8 means manual average is 8 minutes longer.
takeaway
Replacing Auto by 1−Manual expresses identical predictions using reversed group labels.
27 / 33 · 00:34:35
P9(b): Do fitted values or residuals change?
chapter 5 additional material.pdf, PDF page 4, printed page 11.
Part B continues the process-time question. We rewrote fifty-two minus eight times Auto as forty-four plus eight times Manual, where the coding is reversed. Would a particular observation's fitted value change? Would its residual change?
try it first
Name the quantity, choose the method and keep track of the units before opening the solution.
show worked solution
Equivalent equations 52−8Auto and 44+8Manual.
Residual=actual Minutes−fitted Minutes.
step by step
Automated: 52−8(1)=44+8(0)=44.
Manual: 52−8(0)=44+8(1)=52.
Actual unchanged and fitted unchanged → residual unchanged.
why it works
Take an automated observation first. Its original Auto value is one, giving fifty-two minus eight, or forty-four minutes. Its new Manual value is zero, giving forty-four plus zero, again forty-four. A manual observation similarly receives fifty-two minutes in either coding.
Thus no observation's fitted value changes. A residual equals actual outcome minus fitted outcome. The actual minutes have not changed, and we just showed that the fitted minutes have not changed, so the residual cannot change either.
This is a relabeling of the same two groups, not the introduction of new information or a better-fitting model. A sign change in the displayed slope does not necessarily mean predictions changed; here it reflects which group we chose as the baseline.
final answer
Neither fitted values nor residuals change.
takeaway
Equivalent algebra produces the same prediction; unchanged actual minus unchanged prediction leaves residual unchanged.
28 / 33 · 00:35:50
P9(c): Compare tests under reversed coding
chapter 5 additional material.pdf, PDF page 4, printed page 11.
Part C gives the standard error of the recoded slope as three point two zero, the same as the original slope error. The Auto coefficient is negative eight and the Manual coefficient is positive eight. Compare their two-sided zero-slope test statistics and p-values, and give the decisions at five percent.
try it first
Name the quantity, choose the method and keep track of the units before opening the solution.
show worked solution
Original slope −8; recoded slope +8.
Both slope SEs3.20.
Both null slopes0; two-sided tests at5%.
step by step
Auto t=(−8−0)/3.20=−2.50.
Manual t=(8−0)/3.20=+2.50.
Both p=2P(Z>2.5)=0.0124193≈0.0124.
Both reject at5%.
why it works
For Auto, calculate negative eight divided by three point two. The statistic is negative two point five. For Manual, positive eight divided by three point two gives positive two point five.
The signs differ, but both statistics are two and a half standard errors away from zero. A two-sided test counts extremeness in either direction, so both p-values are identical: approximately zero point zero one two four. That is below point zero five. Reject the zero-slope null under both codings.
Changing which group is called one reverses the estimated difference, but not the evidence that the means differ. Be careful that this argument concerns two-sided tests. For a one-sided test, reversing labels would require matching the direction of the substantive claim too.
final answer
t_Auto=−2.50; t_Manual=+2.50; same two-sided p≈0.0124; reject both at5%.
takeaway
Two-sided tests use magnitude of standardized distance, which sign reversal preserves.
29 / 33 · 00:37:11
P10(a): A three-kilometer decrease
chapter 5 additional material.pdf, PDF page 4, printed page 11.
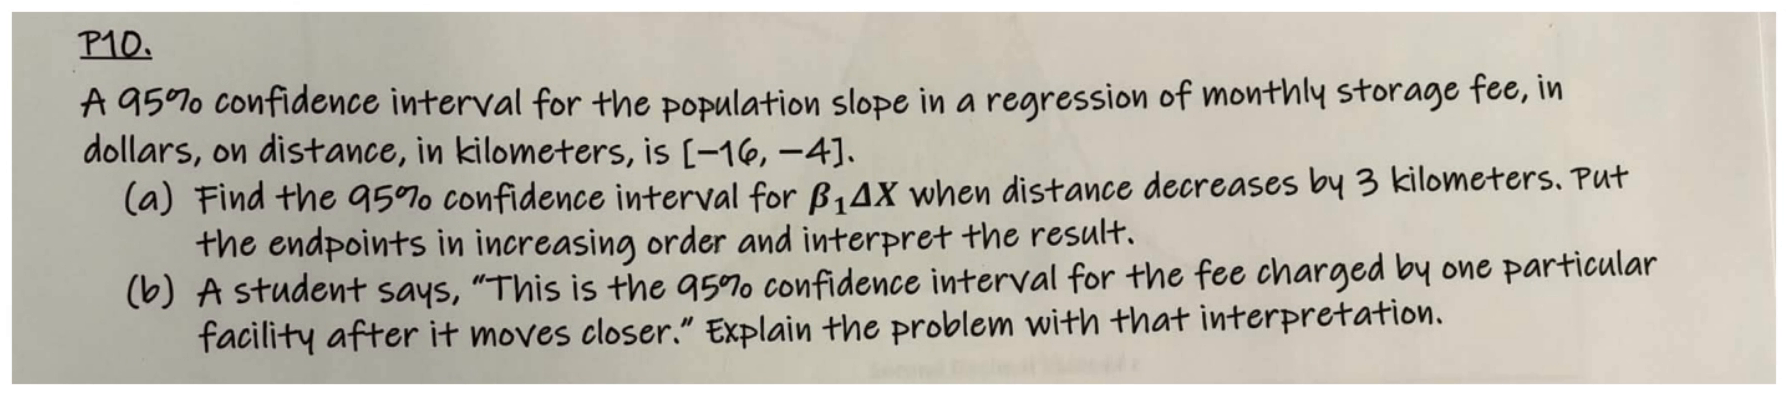
Practice Ten models monthly storage fee in dollars using distance in kilometers. Its ninety-five-percent population slope interval is negative sixteen to negative four dollars per kilometer. Part A asks for the interval for beta one times the change in distance when distance decreases by three kilometers. Put the endpoints in increasing order and interpret the answer.
try it first
Name the quantity, choose the method and keep track of the units before opening the solution.
show worked solution
Slope95%CI[−16,−4] dollars per kilometer.
Distance decreases3km, so ΔX=−3.
step by step
ΔX=−3km.
(−16)(−3)=48; (−4)(−3)=12.
Reorder to [12,48] dollars.
Interpret positive change in model’s population mean monthly fee.
why it works
A decrease of three means delta X is negative three. Multiply both slope endpoints by negative three. Negative sixteen times negative three is positive forty-eight. Negative four times negative three is positive twelve.
Because the multiplier is negative, the endpoint order reverses. Write the final interval as twelve to forty-eight dollars, not forty-eight to twelve. Kilometers cancel, so the answer is a change in the monthly fee measured in dollars.
The model associates a three-kilometer decrease with a population mean fee increase in that range. The positive result is not a mistake: both the slope and distance change are negative. Follow the stated model rather than changing the sign to match an intuition about what moving closer ought to cost.
final answer
95% CI [12,48] dollars for the population regression-mean change, an increase.
takeaway
Multiplying slope by a fixed distance change cancels kilometers and gives dollars.
30 / 33 · 00:38:37
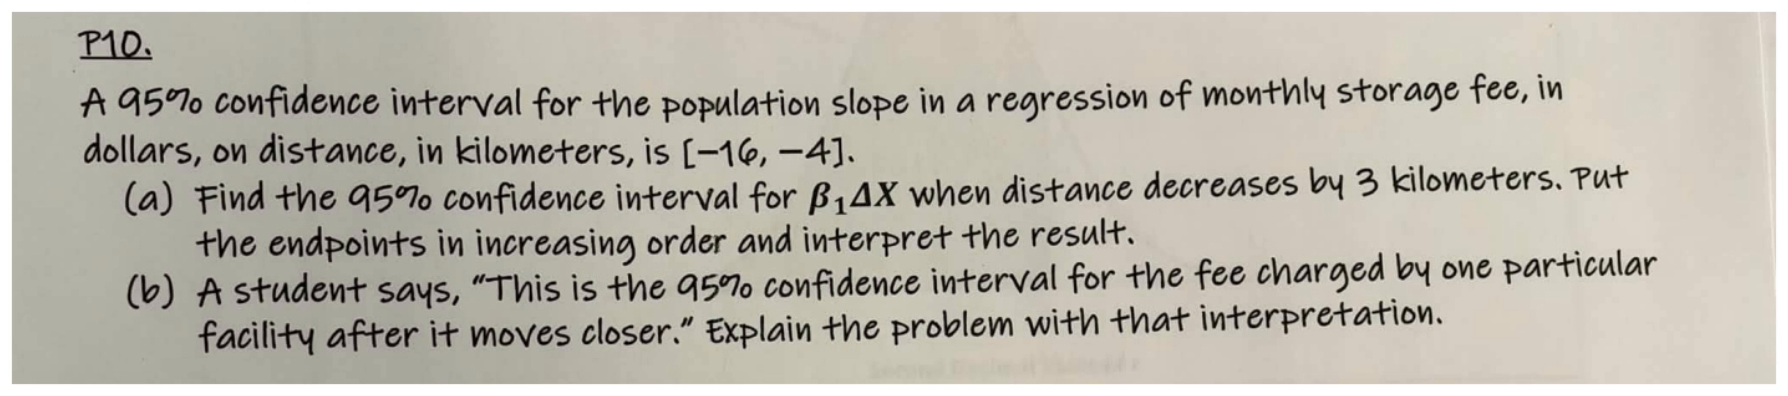
P10(b): Mean change is not an individual bill
chapter 5 additional material.pdf, PDF page 4, printed page 11.
Part B asks us to evaluate a student's interpretation of the storage-fee answer. The student says this is the ninety-five-percent interval for the fee charged by one particular facility after it moves closer. We found an interval of twelve to forty-eight dollars for the model's mean change when distance decreases by three kilometers. What is wrong with the student's statement?
try it first
Name the quantity, choose the method and keep track of the units before opening the solution.
show worked solution
Interval[12,48] dollars concerns β₁ΔX, not a fee level.
Outcome monthly fee; regressor distance.
step by step
β₁ΔX is a mean change, not final outcome level.
Individual future outcomes include unexplained variation.
Coefficient CI is not an individual prediction interval.
There are two distinctions. First, our interval describes a change, not the final fee level. Twelve to forty-eight dollars is the estimated range of increase in the population regression mean, not the entire future bill.
Second, the interval concerns that mean relationship, not one facility's actual outcome. An individual facility can differ from the line because of other influences. Predicting its future bill would require an appropriate prediction calculation, including individual uncertainty, and enough information about the level.
There is also a causality caution. A regression association between distance and fees does not, by itself, prove what moving one facility will cause. Keep the model's average association separate from an individual forecast or a causal promise.
final answer
The interval concerns population regression-mean change, not one facility’s future total fee; individual prediction needs additional information and uncertainty.
takeaway
A coefficient-change interval concerns the population regression mean; prediction requires additional uncertainty and a level.
31 / 33 · 00:40:02
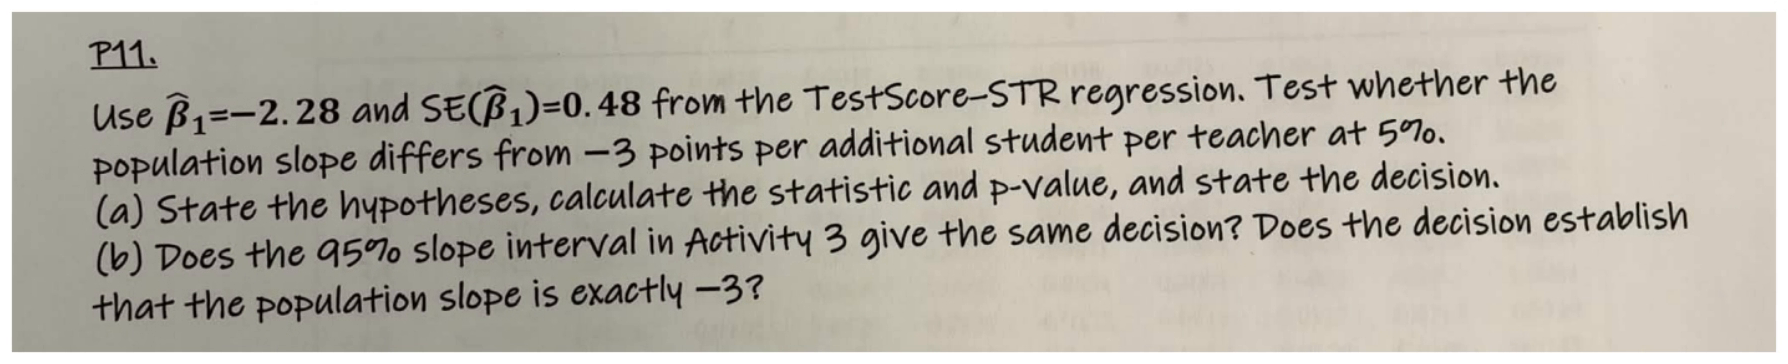
P11(a): Test a slope of negative three
chapter 5 additional material.pdf, PDF page 4, printed page 11.
Practice Eleven returns to Test Score and the student-to-teacher ratio. The estimated slope is negative two point two eight with standard error zero point four eight. This time the question asks whether the population slope differs from negative three points per additional student per teacher at five percent. Part A requests hypotheses, statistic, p-value, and decision.
try it first
Name the quantity, choose the method and keep track of the units before opening the solution.
The null is beta one equals negative three. The alternative is beta one not equal to negative three. The numerator is estimate minus null: negative two point two eight minus negative three. Subtracting a negative gives positive zero point seven two.
Divide zero point seven two by zero point four eight to get one point five zero. For a two-sided standard-normal test, the p-value is approximately zero point one three three six. Since that exceeds point zero five, fail to reject.
The same slope estimate strongly rejected zero earlier, but does not reject negative three. That is sensible: negative three is much closer to the observed estimate than zero is, relative to the same uncertainty. A test result depends on the proposed value, not only on whether the estimated coefficient is negative.
final answer
t=1.50; two-sided p≈.1336; fail to reject H₀:β₁=−3 at5%.
takeaway
Use the hypothesized value actually requested, including its negative sign.
32 / 33 · 00:41:33
P11(b): Check interval agreement without proving the null
chapter 5 additional material.pdf, PDF page 4, printed page 11.
Part B asks two follow-up questions about the negative-three null. Does the ninety-five-percent slope interval from Activity Three give the same decision, and does the decision establish that the population slope is exactly negative three? That interval runs from negative three point two two zero eight to negative one point three three nine two.
try it first
Name the quantity, choose the method and keep track of the units before opening the solution.
show worked solution
95% slopeCI[−3.2208,−1.3392].
Null−3; test in part(a) failed to reject.
step by step
−3 lies in [−3.2208,−1.3392].
Matching test therefore fails to reject.
Nonrejection does not identify −3 as uniquely true.
why it works
Place negative three between the endpoints. It is inside the interval, so the matching five-percent two-sided test fails to reject. Yes, the interval agrees with the calculation in part A.
But no, that does not prove exact equality. The data leave a range of population slopes compatible with this method. Negative three is one of those values, not the only possible value.
Say, we do not have sufficient evidence to reject negative three at five percent. Do not say, we proved the slope is negative three. A failure to detect a difference and a demonstration of exact equality are different claims.
final answer
Yes, interval agrees. No, failure to reject does not establish that β₁ is exactly−3.
takeaway
A matching two-sided interval and test agree about null values inside the interval.
33 / 33 · 00:42:44
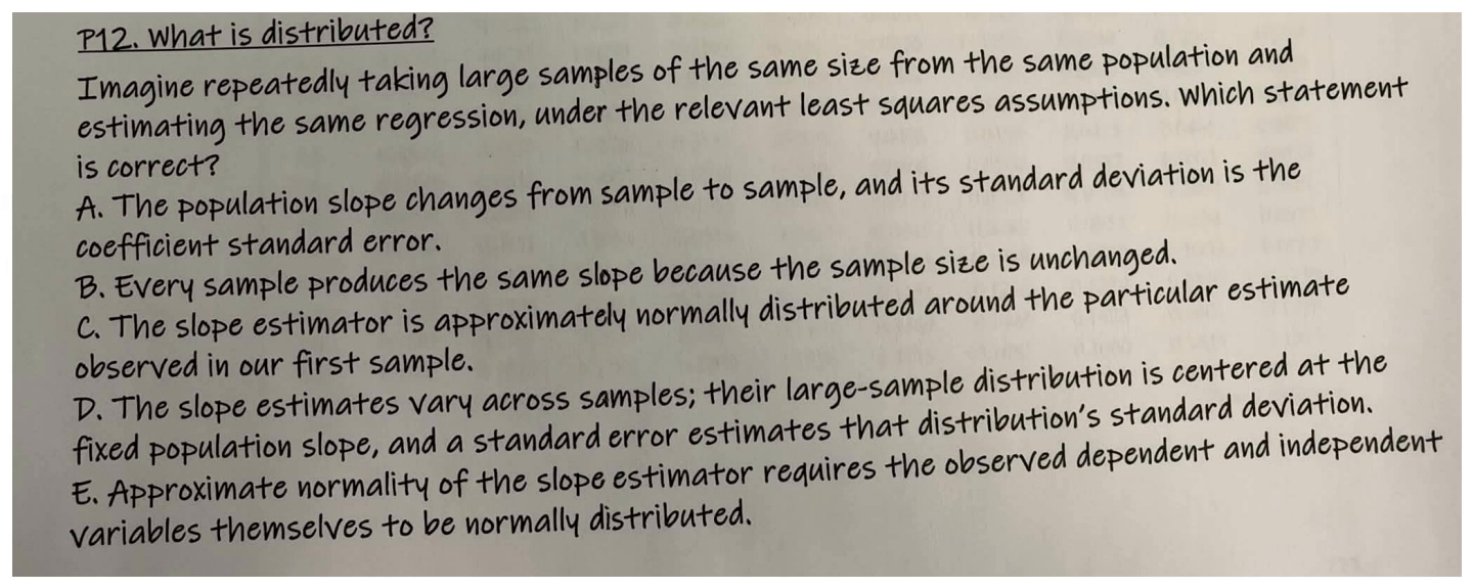
P12: What actually has a sampling distribution?
chapter 5 additional material.pdf, PDF page 4, printed page 11.
Practice Twelve asks us to imagine repeatedly taking large samples of the same size from one population and estimating the same regression under the relevant assumptions. Which statement correctly describes what is distributed?
try it first
Name the quantity, choose the method and keep track of the units before opening the solution.
show worked solution
Repeated large same-size samples; same population and model.
Relevant least-squares assumptions hold.
step by step
Estimator β̂₁ varies; population β₁ fixed.
Large-sample distribution centered at β₁ under assumptions.
SE estimates estimator-distribution SD.
Select D; normal raw X/Y not required.
why it works
The estimated slopes vary from sample to sample. Their large-sample distribution is centered at the fixed population slope, and a standard error estimates that distribution's standard deviation. In plain language, different samples give slightly different measurements of one underlying relationship, and the standard error estimates how much those measurements tend to vary.
Choice A incorrectly moves the population parameter around. Choice B incorrectly assumes equal sample size means identical data or estimates. Choice C incorrectly centers the distribution at our first sample's estimate instead of the population coefficient. Choice E adds a condition we do not need: the observed X and Y do not themselves have to be normally distributed for the estimator's stated large-sample approximation.
This brings us back to Activity One: keep the fixed population target, the changing sample estimate, and the estimate's uncertainty separate.
The correct choice is D.
final answer
D: estimates vary around fixed β₁; SE estimates the sampling distribution’s SD.
takeaway
Sampling uncertainty belongs to the estimator; large-sample normality does not require raw X and Y to be normal.